

11.3.2 Mini Lander Data
Although the scattered data shown in Fig. 11.5 result from tidal dynamics, the
overall picture remains heterogeneous (Fig. 11.6) indicating a possible semi-diurnal
pattern. The high-resolution data sampling using a lander system and its subsequent
processing exhibit a more detailed picture. The pressure data reveal a distinct semidiurnal tide signal encompassing very little more than 3 m water column variability,
which is in good agreement with the record of the tide station Gijo ´n (Fig. 11.6). This
is expressed in the varying pressure readings at the deployment site between
775 and 778 mbsl (Fig. 11.7a). The tidal pressure analysis was conducted applying
the Matlab software T_Tide. It provides a tidal harmonic analysis including error
estimates (Pawlowicz et al. 2002) indicating the influence of the principle lunar
semi-diurnal constituent M2 with a dominant signal noise ratio of 9.2e + 05. In
addition the lunar diurnal constituent also exhibits a very strong signal noise ratio of
1.3e + 04.
0
3000
b
a
2000
Depth [m]
Depth [m]
1000
3000
2000
1000
0
0
- W -
- W -
- E -
- E -
10
20
Section Distance [km]
30
0
1 0
2 0
Section Distance [km]
30
0
0.005
0.01
sigalinity (psu) 10m
Δ
0.015
0.02
0
0.002
0.004
0.006
sigma-theta
10m
( )
sQ
Δ
0.008
0.01
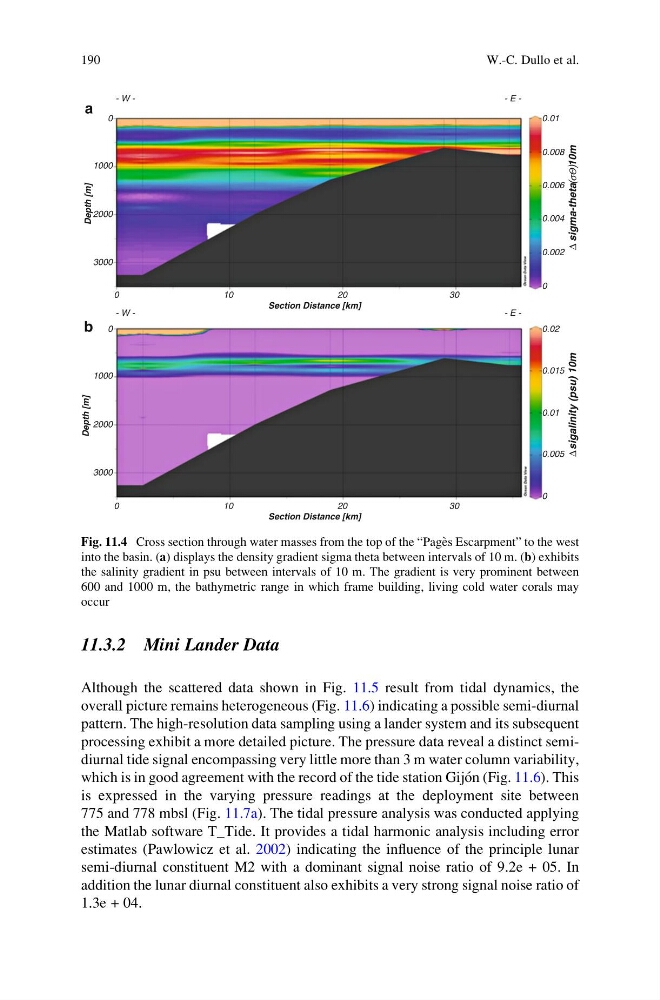
Fig. 11.4 Cross section through water masses from the top of the “Page `s Escarpment” to the west
into the basin. (a) displays the density gradient sigma theta between intervals of 10 m. (b) exhibits
the salinity gradient in psu between intervals of 10 m. The gradient is very prominent between
600 and 1000 m, the bathymetric range in which frame building, living cold water corals may
occur
190
W.-C. Dullo et al.
Although the scattered data shown in Fig. 11.5 result from tidal dynamics, the
overall picture remains heterogeneous (Fig. 11.6) indicating a possible semi-diurnal
pattern. The high-resolution data sampling using a lander system and its subsequent
processing exhibit a more detailed picture. The pressure data reveal a distinct semidiurnal tide signal encompassing very little more than 3 m water column variability,
which is in good agreement with the record of the tide station Gijo ´n (Fig. 11.6). This
is expressed in the varying pressure readings at the deployment site between
775 and 778 mbsl (Fig. 11.7a). The tidal pressure analysis was conducted applying
the Matlab software T_Tide. It provides a tidal harmonic analysis including error
estimates (Pawlowicz et al. 2002) indicating the influence of the principle lunar
semi-diurnal constituent M2 with a dominant signal noise ratio of 9.2e + 05. In
addition the lunar diurnal constituent also exhibits a very strong signal noise ratio of
1.3e + 04.
0
3000
b
a
2000
Depth [m]
Depth [m]
1000
3000
2000
1000
0
0
- W -
- W -
- E -
- E -
10
20
Section Distance [km]
30
0
1 0
2 0
Section Distance [km]
30
0
0.005
0.01
sigalinity (psu) 10m
Δ
0.015
0.02
0
0.002
0.004
0.006
sigma-theta
10m
( )
sQ
Δ
0.008
0.01
Fig. 11.4 Cross section through water masses from the top of the “Page `s Escarpment” to the west
into the basin. (a) displays the density gradient sigma theta between intervals of 10 m. (b) exhibits
the salinity gradient in psu between intervals of 10 m. The gradient is very prominent between
600 and 1000 m, the bathymetric range in which frame building, living cold water corals may
occur
190
W.-C. Dullo et al.