

interval between 740 and 760 mbsl in Fig. 11.5. These time lapse measurements
portray a variation which might be related to tidal dynamics. Due to current
dynamics and related navigational issues the repeated casts never passed through
the water column at the same spot. Even CTD casts performed from a fully DGPS
(Differential Global Positioning System) controlled surface vessel still would have
to cope with dynamic current regimes in the water masses the CTD is penetrating.
This problem is getting larger with increasing water depths. However, plotting the
casts as a time series reveals the influence of the tides in this water depth which is in
concert to the measured tidal signal from the nearest coastal station in Gijo ´n
exhibiting 3 m of vertical variability (Fig. 11.6).
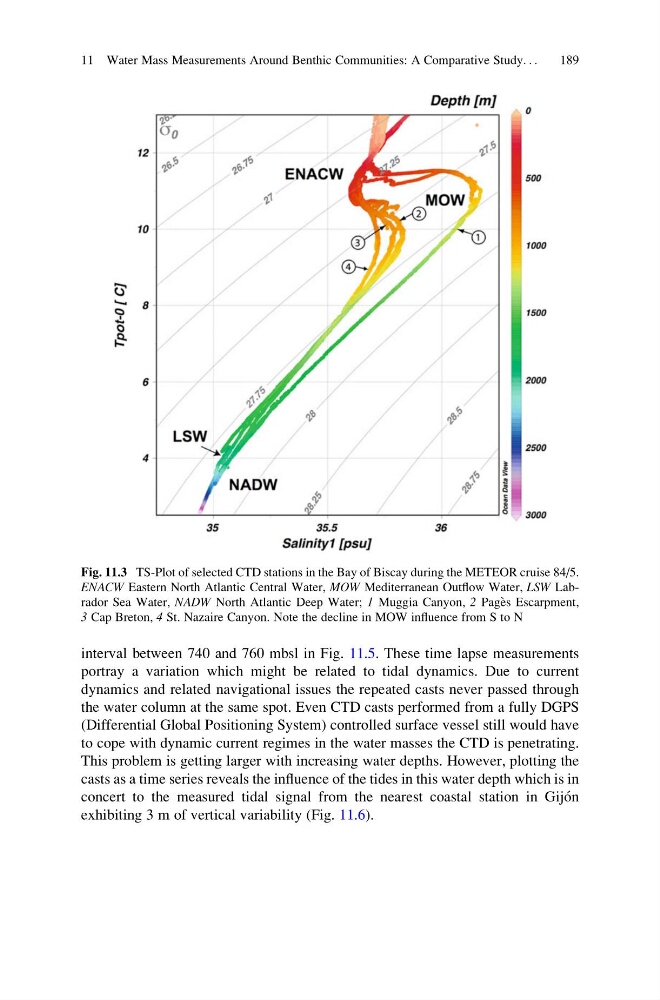
Fig. 11.3 TS-Plot of selected CTD stations in the Bay of Biscay during the METEOR cruise 84/5.
ENACW Eastern North Atlantic Central Water, MOW Mediterranean Outflow Water, LSW Labrador Sea Water, NADW North Atlantic Deep Water; 1 Muggia Canyon, 2 Page `s Escarpment,
3 Cap Breton, 4 St. Nazaire Canyon. Note the decline in MOW influence from S to N
11 Water Mass Measurements Around Benthic Communities: A Comparative Study. . .
189
portray a variation which might be related to tidal dynamics. Due to current
dynamics and related navigational issues the repeated casts never passed through
the water column at the same spot. Even CTD casts performed from a fully DGPS
(Differential Global Positioning System) controlled surface vessel still would have
to cope with dynamic current regimes in the water masses the CTD is penetrating.
This problem is getting larger with increasing water depths. However, plotting the
casts as a time series reveals the influence of the tides in this water depth which is in
concert to the measured tidal signal from the nearest coastal station in Gijo ´n
exhibiting 3 m of vertical variability (Fig. 11.6).
Fig. 11.3 TS-Plot of selected CTD stations in the Bay of Biscay during the METEOR cruise 84/5.
ENACW Eastern North Atlantic Central Water, MOW Mediterranean Outflow Water, LSW Labrador Sea Water, NADW North Atlantic Deep Water; 1 Muggia Canyon, 2 Page `s Escarpment,
3 Cap Breton, 4 St. Nazaire Canyon. Note the decline in MOW influence from S to N
11 Water Mass Measurements Around Benthic Communities: A Comparative Study. . .
189