

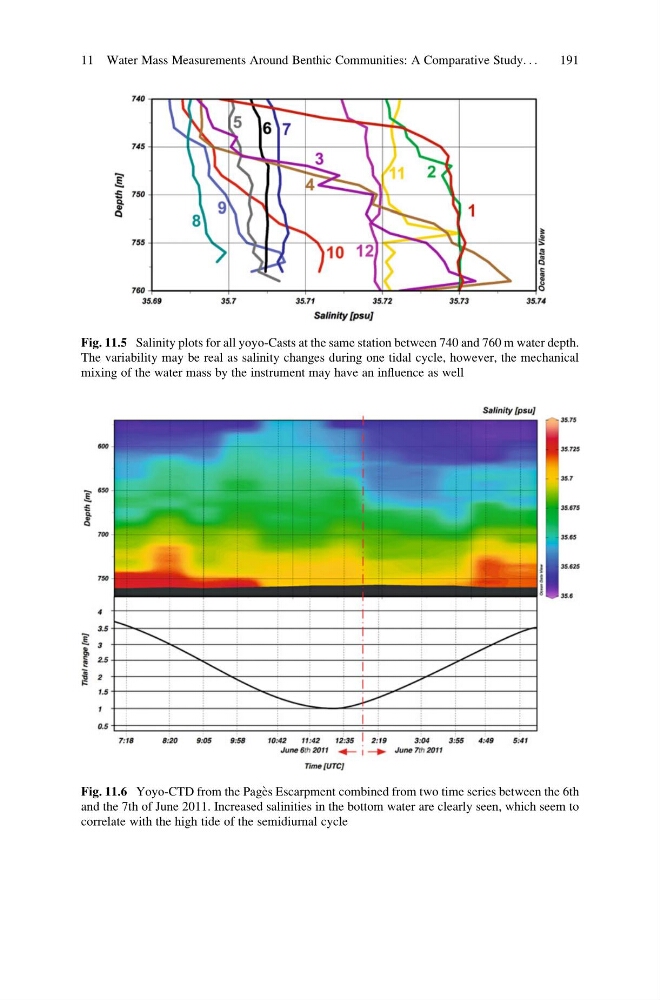
Fig. 11.5 Salinity plots for all yoyo-Casts at the same station between 740 and 760 m water depth.
The variability may be real as salinity changes during one tidal cycle, however, the mechanical
mixing of the water mass by the instrument may have an influence as well
Fig. 11.6 Yoyo-CTD from the Page `s Escarpment combined from two time series between the 6th
and the 7th of June 2011. Increased salinities in the bottom water are clearly seen, which seem to
correlate with the high tide of the semidiurnal cycle
11 Water Mass Measurements Around Benthic Communities: A Comparative Study. . .
191
The variability may be real as salinity changes during one tidal cycle, however, the mechanical
mixing of the water mass by the instrument may have an influence as well
Fig. 11.6 Yoyo-CTD from the Page `s Escarpment combined from two time series between the 6th
and the 7th of June 2011. Increased salinities in the bottom water are clearly seen, which seem to
correlate with the high tide of the semidiurnal cycle
11 Water Mass Measurements Around Benthic Communities: A Comparative Study. . .
191