

surface water layer (Table 10.1). Regard must be paid to comparison of the data
obtained by measurements performed during each season at the same stations
repeatedly. The C/Chl and C/N values did not change greatly compared to the
surface water layer; this pertains to a similar SOM composition in these layers,
represented mostly by phytoplankton and newly formed detritus.
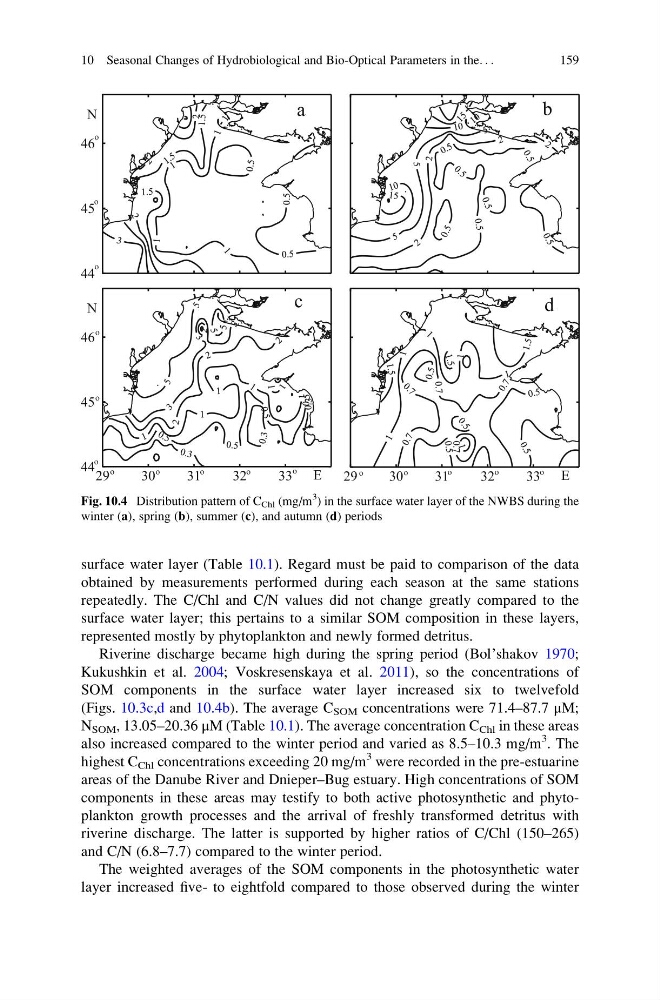
Riverine discharge became high during the spring period (Bol’shakov 1970;
Kukushkin et al. 2004; Voskresenskaya et al. 2011), so the concentrations of
SOM components in the surface water layer increased six to twelvefold
(Figs. 10.3c,d and 10.4b). The average C SOM concentrations were 71.4–87.7 μM;
N SOM , 13.05–20.36 μM (Table 10.1). The average concentration C Chl in these areas
also increased compared to the winter period and varied as 8.5–10.3 mg/m
3 . The
highest C Chl concentrations exceeding 20 mg/m
3 were recorded in the pre-estuarine
areas of the Danube River and Dnieper–Bug estuary. High concentrations of SOM
components in these areas may testify to both active photosynthetic and phytoplankton growth processes and the arrival of freshly transformed detritus with
riverine discharge. The latter is supported by higher ratios of C/Chl (150–265)
and C/N (6.8–7.7) compared to the winter period.
The weighted averages of the SOM components in the photosynthetic water
layer increased five- to eightfold compared to those observed during the winter
Fig. 10.4 Distribution pattern of C Chl (mg/m
3
) in the surface water layer of the NWBS during the
winter (a), spring (b), summer (c), and autumn (d) periods
10 Seasonal Changes of Hydrobiological and Bio-Optical Parameters in the. . .
159
obtained by measurements performed during each season at the same stations
repeatedly. The C/Chl and C/N values did not change greatly compared to the
surface water layer; this pertains to a similar SOM composition in these layers,
represented mostly by phytoplankton and newly formed detritus.
Riverine discharge became high during the spring period (Bol’shakov 1970;
Kukushkin et al. 2004; Voskresenskaya et al. 2011), so the concentrations of
SOM components in the surface water layer increased six to twelvefold
(Figs. 10.3c,d and 10.4b). The average C SOM concentrations were 71.4–87.7 μM;
N SOM , 13.05–20.36 μM (Table 10.1). The average concentration C Chl in these areas
also increased compared to the winter period and varied as 8.5–10.3 mg/m
3 . The
highest C Chl concentrations exceeding 20 mg/m
3 were recorded in the pre-estuarine
areas of the Danube River and Dnieper–Bug estuary. High concentrations of SOM
components in these areas may testify to both active photosynthetic and phytoplankton growth processes and the arrival of freshly transformed detritus with
riverine discharge. The latter is supported by higher ratios of C/Chl (150–265)
and C/N (6.8–7.7) compared to the winter period.
The weighted averages of the SOM components in the photosynthetic water
layer increased five- to eightfold compared to those observed during the winter
Fig. 10.4 Distribution pattern of C Chl (mg/m
3
) in the surface water layer of the NWBS during the
winter (a), spring (b), summer (c), and autumn (d) periods
10 Seasonal Changes of Hydrobiological and Bio-Optical Parameters in the. . .
159