

period, but were less than 1.5–2.1 times compared to those observed in the surface
water layer. The C/Chl values did not change greatly in either layer, but the C/N
ratio decreased (6.4–6.5) compared to the surface water layer and came close to the
value of 6.7 characteristic of newly synthesized SOM (Romankevich 1977). Therefore, a similar SOM composition was observed for the 0–20 m layer, and SOM was
represented mostly by phytoplankton and newly formed detritus.
During the summer period, the concentrations of SOM components in both water
layers decreased compared to the spring period by approximately 2.0–2.5 times
(Figs. 10.3e,f and 10.4c; Table 10.1); however, it remained relatively high. Meanwhile, the concentration N SOM in the northern area decreased by 1.3 times, and
a
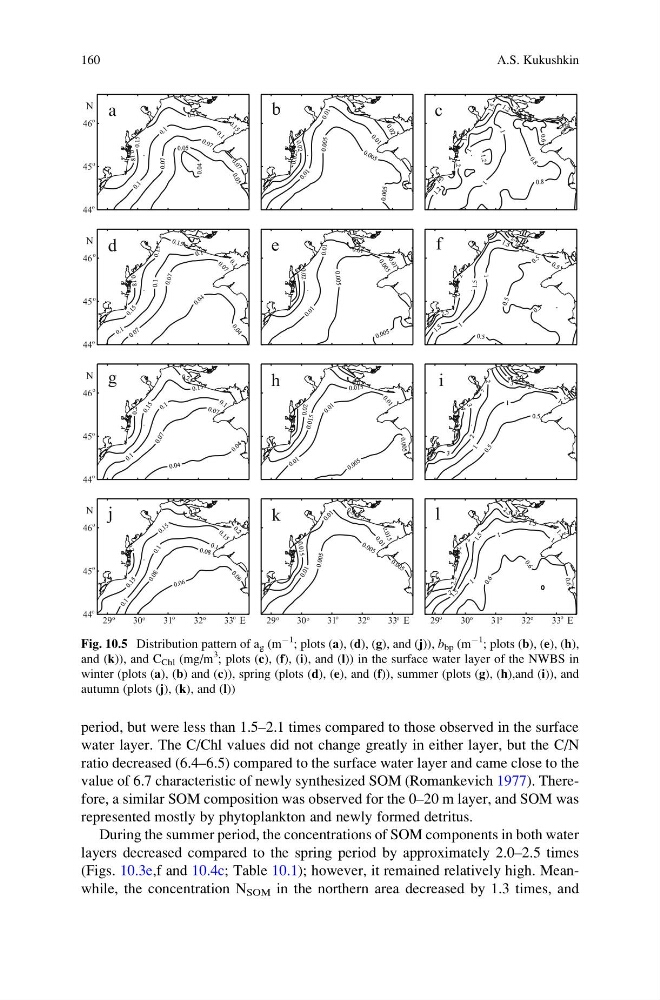
Fig. 10.5 Distribution pattern of a g (m
À1
; plots (a), (d), (g), and (j)), b bp (m
À1
; plots (b), (e), (h),
and (k)), and C Chl (mg/m
3
; plots (c), (f), (i), and (l)) in the surface water layer of the NWBS in
winter (plots (a), (b) and (c)), spring (plots (d), (e), and (f)), summer (plots (g), (h),and (i)), and
autumn (plots (j), (k), and (l))
160
A.S. Kukushkin
water layer. The C/Chl values did not change greatly in either layer, but the C/N
ratio decreased (6.4–6.5) compared to the surface water layer and came close to the
value of 6.7 characteristic of newly synthesized SOM (Romankevich 1977). Therefore, a similar SOM composition was observed for the 0–20 m layer, and SOM was
represented mostly by phytoplankton and newly formed detritus.
During the summer period, the concentrations of SOM components in both water
layers decreased compared to the spring period by approximately 2.0–2.5 times
(Figs. 10.3e,f and 10.4c; Table 10.1); however, it remained relatively high. Meanwhile, the concentration N SOM in the northern area decreased by 1.3 times, and
a
Fig. 10.5 Distribution pattern of a g (m
À1
; plots (a), (d), (g), and (j)), b bp (m
À1
; plots (b), (e), (h),
and (k)), and C Chl (mg/m
3
; plots (c), (f), (i), and (l)) in the surface water layer of the NWBS in
winter (plots (a), (b) and (c)), spring (plots (d), (e), and (f)), summer (plots (g), (h),and (i)), and
autumn (plots (j), (k), and (l))
160
A.S. Kukushkin