

a
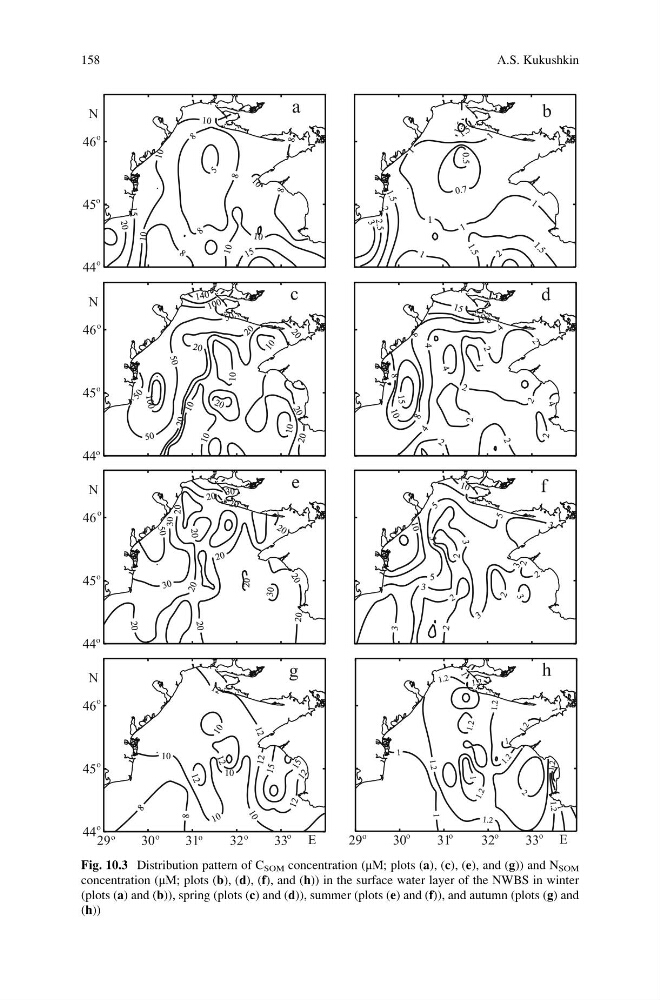
Fig. 10.3 Distribution pattern of C SOM concentration (μM; plots (a), (c), (e), and (g)) and N SOM
concentration (μM; plots (b), (d), (f), and (h)) in the surface water layer of the NWBS in winter
(plots (a) and (b)), spring (plots (c) and (d)), summer (plots (e) and (f)), and autumn (plots (g) and
(h))
158
A.S. Kukushkin
Fig. 10.3 Distribution pattern of C SOM concentration (μM; plots (a), (c), (e), and (g)) and N SOM
concentration (μM; plots (b), (d), (f), and (h)) in the surface water layer of the NWBS in winter
(plots (a) and (b)), spring (plots (c) and (d)), summer (plots (e) and (f)), and autumn (plots (g) and
(h))
158
A.S. Kukushkin