

194
Exercise 12
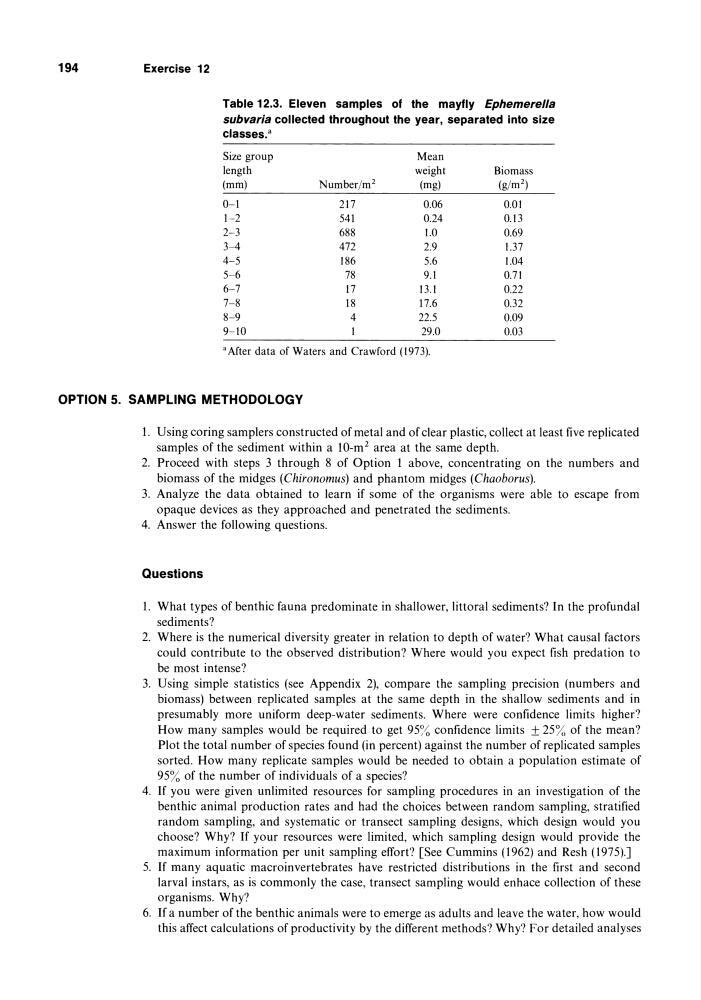
Table 12.3. Eleven samples of the mayfly Ephemerella
sub varia collected throughout the year, separated into size
classes."
Size group
Mean
length
weight
(mm)
Number/m2
(mg)
0-1
217
0.06
1-2
541
0.24
2-3
688
1.0
3-4
472
2.9
4-5
186
5.6
5-6
78
9.1
6-7
17
13.1
7-8
18
17.6
8-9
4
22.5
9-10
29.0
a After data of Waters and Crawford (1973).
Biomass
(g/m2)
0.01
0.13
0.69
1.37
1.04
0.71
0.22
0.32
0.09
0.03
OPTION 5. SAMPLING METHODOLOGY
1. Using coring samplers constructed of metal and of clear plastic, collect at least five replicated
samples of the sediment within a lO-m2 area at the same depth.
2. Proceed with steps 3 through 8 of Option 1 above, concentrating on the numbers and
biomass of the midges (Chironomus) and phantom midges (Chaoborus).
3. Analyze the data obtained to learn if some of the organisms werc able to escape from
opaque devices as they approached and penetrated the sediments.
4. Answer the following questions.
Questions
1. What types of benthic fauna predominate in shallower, littoral sediments? In the profundal
sediments?
2. Where is the numerical diversity greater in relation to depth of water? What causal factors
could contribute to the observed distribution? Where would you expect fish predation to
be most intense?
3. Using simple statistics (see Appendix 2), compare the sampling precision (numbers and
biomass) between replicated samples at the same depth in the shallow sediments and in
presumably more uniform deep-water sediments. Where were confidence limits higher?
How many samples would be required to get 95~~ confidence limits ± 25% of the mean?
Plot the total number of species found (in percent) against the number of replicated samples
sorted. How many replicate samples would be needed to obtain a population estimate of
95% of the number of individuals of a species?
4. If you were given unlimited resources for sampling procedures in an investigation of the
benthic animal production rates and had the choices between random sampling, stratified
random sampling, and systematic or transect sampling designs, which design would you
choose? Why? If your resources were limited, which sampling design would provide the
maximum information per unit sampling effort? [See Cummins (1962) and Resh (1975).J
5. If many aquatic macroinvertebrates have restricted distributions in the first and second
larval instars, as is commonly the case, transect sampling would enhace collection of these
organisms. Why?
6. If a number of the benthic animals were to emerge as adults and leave the water, how would
this affect calculations of productivity by the different methods? Why? For detailed analyses
Exercise 12
Table 12.3. Eleven samples of the mayfly Ephemerella
sub varia collected throughout the year, separated into size
classes."
Size group
Mean
length
weight
(mm)
Number/m2
(mg)
0-1
217
0.06
1-2
541
0.24
2-3
688
1.0
3-4
472
2.9
4-5
186
5.6
5-6
78
9.1
6-7
17
13.1
7-8
18
17.6
8-9
4
22.5
9-10
29.0
a After data of Waters and Crawford (1973).
Biomass
(g/m2)
0.01
0.13
0.69
1.37
1.04
0.71
0.22
0.32
0.09
0.03
OPTION 5. SAMPLING METHODOLOGY
1. Using coring samplers constructed of metal and of clear plastic, collect at least five replicated
samples of the sediment within a lO-m2 area at the same depth.
2. Proceed with steps 3 through 8 of Option 1 above, concentrating on the numbers and
biomass of the midges (Chironomus) and phantom midges (Chaoborus).
3. Analyze the data obtained to learn if some of the organisms werc able to escape from
opaque devices as they approached and penetrated the sediments.
4. Answer the following questions.
Questions
1. What types of benthic fauna predominate in shallower, littoral sediments? In the profundal
sediments?
2. Where is the numerical diversity greater in relation to depth of water? What causal factors
could contribute to the observed distribution? Where would you expect fish predation to
be most intense?
3. Using simple statistics (see Appendix 2), compare the sampling precision (numbers and
biomass) between replicated samples at the same depth in the shallow sediments and in
presumably more uniform deep-water sediments. Where were confidence limits higher?
How many samples would be required to get 95~~ confidence limits ± 25% of the mean?
Plot the total number of species found (in percent) against the number of replicated samples
sorted. How many replicate samples would be needed to obtain a population estimate of
95% of the number of individuals of a species?
4. If you were given unlimited resources for sampling procedures in an investigation of the
benthic animal production rates and had the choices between random sampling, stratified
random sampling, and systematic or transect sampling designs, which design would you
choose? Why? If your resources were limited, which sampling design would provide the
maximum information per unit sampling effort? [See Cummins (1962) and Resh (1975).J
5. If many aquatic macroinvertebrates have restricted distributions in the first and second
larval instars, as is commonly the case, transect sampling would enhace collection of these
organisms. Why?
6. If a number of the benthic animals were to emerge as adults and leave the water, how would
this affect calculations of productivity by the different methods? Why? For detailed analyses