

Benthic Fauna of Lakes
193
OPTION 2. FIELD ANALYSES (ALTERNATIVE B)
1. In a lake or reservoir, locate one point at the same depth and collect five replicated samples
of the sediment in a 10 x 10 m area with two or more different sampling devices (e.g., an
Ekman grab and multiple corer).
2. Proceed with steps 3 through 8 of Option 1 above.
3. By comparison of your results, test the variability of sampling and heterogeneity of
distribution of benthic fauna.
4. Answer the questions following Option 5, emphasizing particularly Question 3.
OPTION 3. LABORATORY ANALYSES
1. Using,the samples provided by your instructor, sieve the samples with the finest sized mesh
screens that time will permit.
2. With replicate samples and a large homogeneous sediment sample, sieve the samples with
(a) a screen of about O.4-mm opening and (b) a screen of about O.2-mm.
3. Sort the samples to remove the organisms from the sediments. Use flotation methods and
dyes, as discussed previously, to facilitate quantitative sorting.
4. Identify the organisms collected to the most specific level possible under the conditions of
time and experience. Enumerate the organisms of each category.
5. Determine the biomass of the benthic organisms by dry and organic weight analyses.
6. Analyze your data in relation to gradients of depth, temperature, dissolved oxygen
concentration, sediment composition, and other factors as given to you by your instructor.
7. Answer the questions following Option 5.
OPTION 4. PRODUCTIVITY CALCULATIONS
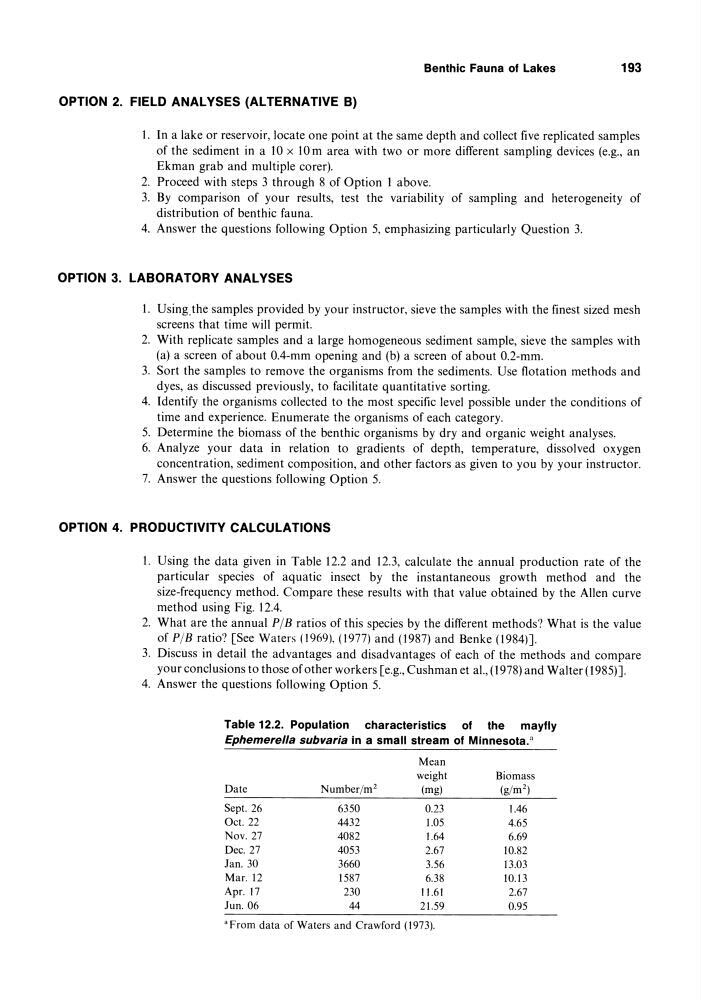
1. Using the data given in Table 12.2 and 12.3, calculate the annual production rate of the
particular species of aquatic insect by the instantaneous growth method and the
size-frequency method. Compare these results with that value obtained by the Allen curve
method using Fig. 12.4.
2. What are the annual PI B ratios of this species by the different methods? What is the value
of PIB ratio? [See Waters (1969), (1977) and (1987) and Benke (1984)].
3. Discuss in detail the advantages and disadvantages of each of the methods and compare
your conclusions to those of other workers [e.g., Cushman et aI., (1978) and Walter (1985)].
4. Answer the questions following Option 5.
Table 12.2. Population characteristics of the mayfly
Ephemerella sub varia in a small stream of Minnesota."
Mean
weight
Biomass
Date
Number/m2
(mg)
(g/m 2 )
Sept. 26
6350
0.23
1.46
Oct. 22
4432
1.05
4.65
Nov. 27
4082
1.64
6.69
Dec. 27
4053
2.67
10.82
Jan. 30
3660
3.56
13.03
Mar. 12
1587
6.38
10.13
Apr. 17
230
11.61
2.67
Jun. 06
44
21.59
0.95
a From data of Waters and Crawford (1973).
193
OPTION 2. FIELD ANALYSES (ALTERNATIVE B)
1. In a lake or reservoir, locate one point at the same depth and collect five replicated samples
of the sediment in a 10 x 10 m area with two or more different sampling devices (e.g., an
Ekman grab and multiple corer).
2. Proceed with steps 3 through 8 of Option 1 above.
3. By comparison of your results, test the variability of sampling and heterogeneity of
distribution of benthic fauna.
4. Answer the questions following Option 5, emphasizing particularly Question 3.
OPTION 3. LABORATORY ANALYSES
1. Using,the samples provided by your instructor, sieve the samples with the finest sized mesh
screens that time will permit.
2. With replicate samples and a large homogeneous sediment sample, sieve the samples with
(a) a screen of about O.4-mm opening and (b) a screen of about O.2-mm.
3. Sort the samples to remove the organisms from the sediments. Use flotation methods and
dyes, as discussed previously, to facilitate quantitative sorting.
4. Identify the organisms collected to the most specific level possible under the conditions of
time and experience. Enumerate the organisms of each category.
5. Determine the biomass of the benthic organisms by dry and organic weight analyses.
6. Analyze your data in relation to gradients of depth, temperature, dissolved oxygen
concentration, sediment composition, and other factors as given to you by your instructor.
7. Answer the questions following Option 5.
OPTION 4. PRODUCTIVITY CALCULATIONS
1. Using the data given in Table 12.2 and 12.3, calculate the annual production rate of the
particular species of aquatic insect by the instantaneous growth method and the
size-frequency method. Compare these results with that value obtained by the Allen curve
method using Fig. 12.4.
2. What are the annual PI B ratios of this species by the different methods? What is the value
of PIB ratio? [See Waters (1969), (1977) and (1987) and Benke (1984)].
3. Discuss in detail the advantages and disadvantages of each of the methods and compare
your conclusions to those of other workers [e.g., Cushman et aI., (1978) and Walter (1985)].
4. Answer the questions following Option 5.
Table 12.2. Population characteristics of the mayfly
Ephemerella sub varia in a small stream of Minnesota."
Mean
weight
Biomass
Date
Number/m2
(mg)
(g/m 2 )
Sept. 26
6350
0.23
1.46
Oct. 22
4432
1.05
4.65
Nov. 27
4082
1.64
6.69
Dec. 27
4053
2.67
10.82
Jan. 30
3660
3.56
13.03
Mar. 12
1587
6.38
10.13
Apr. 17
230
11.61
2.67
Jun. 06
44
21.59
0.95
a From data of Waters and Crawford (1973).