

54
The Radiocarbon Method to Estimate Primary Production
14'
0
H,m
I
25
J
I J
, I
50 I: ,
\
,
"10
I
19'
~Ks
/
/
24'
29' to
Cf)
I
:e \
I
)
1 /
/ . Kt
/ /
- --~
z
12 ~ ___ ' ________________ ~
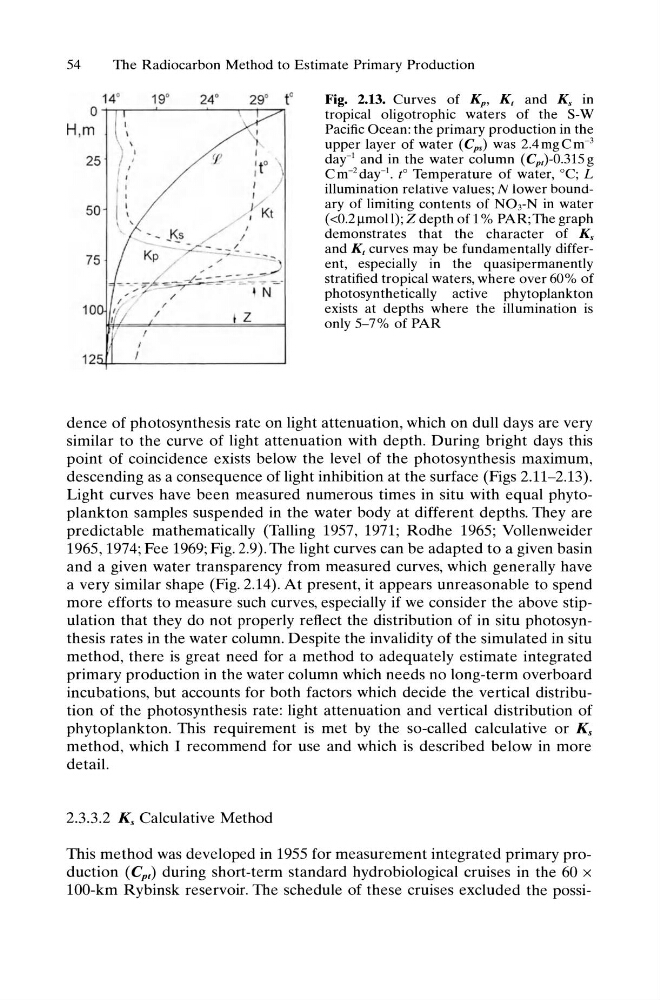
Fig. 2.13. Curves of K p , K, and Ks in
tropical oligotrophic waters of the S-W
Pacific Ocean: the primary production in the
upper layer of water (Cps) was 2.4 mg C m- 3
day-l and in the water column (Cp ,)-0.315 g
C m- 2 day-I. to Temperature of water, °C; L
illumination relatIve values; N lower boundary of limiting contents of NOrN in water
«0.2~moll);Z depth of 1 % PAR; The graph
demonstrates that the character of Ks
and K, curves may be fundamentally different, especially in the quasipermanently
stratified tropical waters, where over 60% of
photosynthetically active phytoplankton
exists at depths where the illumination is
only 5-7% of PAR
dence of photosynthesis rate on light attenuation, which on dull days are very
similar to the curve of light attenuation with depth. During bright days this
point of coincidence exists below the level of the photosynthesis maximum,
descending as a consequence of light inhibition at the surface (Figs 2.11-2.13).
Light curves have been measured numerous times in situ with equal phytoplankton samples suspended in the water body at different depths. They are
predictable mathematically (TaIling 1957, 1971; Rodhe 1965; Vollenweider
1965,1974; Fee 1969; Fig. 2.9). The light curves can be adapted to a given basin
and a given water transparency from measured curves, which generally have
a very similar shape (Fig. 2.14). At present, it appears unreasonable to spend
more efforts to measure such curves, especially if we consider the above stipulation that they do not properly reflect the distribution of in situ photosynthesis rates in the water column. Despite the invalidity of the simulated in situ
method, there is great need for a method to adequately estimate integrated
primary production in the water column which needs no long-term overboard
incubations, but accounts for both factors which decide the vertical distribution of the photosynthesis rate: light attenuation and vertical distribution of
phytoplankton. This requirement is met by the so-called calculative or Ks
method, which I recommend for use and which is described below in more
detail.
2.3.3.2 Ks Calculative Method
This method was developed in 1955 for measurement integrated primary production (Cpt) during short-term standard hydrobiological cruises in the 60 x
100-km Rybinsk reservoir. The schedule of these cruises excluded the possi-
The Radiocarbon Method to Estimate Primary Production
14'
0
H,m
I
25
J
I J
, I
50 I: ,
\
,
"10
I
19'
~Ks
/
/
24'
29' to
Cf)
I
:e \
I
)
1 /
/ . Kt
/ /
- --~
z
12 ~ ___ ' ________________ ~
Fig. 2.13. Curves of K p , K, and Ks in
tropical oligotrophic waters of the S-W
Pacific Ocean: the primary production in the
upper layer of water (Cps) was 2.4 mg C m- 3
day-l and in the water column (Cp ,)-0.315 g
C m- 2 day-I. to Temperature of water, °C; L
illumination relatIve values; N lower boundary of limiting contents of NOrN in water
«0.2~moll);Z depth of 1 % PAR; The graph
demonstrates that the character of Ks
and K, curves may be fundamentally different, especially in the quasipermanently
stratified tropical waters, where over 60% of
photosynthetically active phytoplankton
exists at depths where the illumination is
only 5-7% of PAR
dence of photosynthesis rate on light attenuation, which on dull days are very
similar to the curve of light attenuation with depth. During bright days this
point of coincidence exists below the level of the photosynthesis maximum,
descending as a consequence of light inhibition at the surface (Figs 2.11-2.13).
Light curves have been measured numerous times in situ with equal phytoplankton samples suspended in the water body at different depths. They are
predictable mathematically (TaIling 1957, 1971; Rodhe 1965; Vollenweider
1965,1974; Fee 1969; Fig. 2.9). The light curves can be adapted to a given basin
and a given water transparency from measured curves, which generally have
a very similar shape (Fig. 2.14). At present, it appears unreasonable to spend
more efforts to measure such curves, especially if we consider the above stipulation that they do not properly reflect the distribution of in situ photosynthesis rates in the water column. Despite the invalidity of the simulated in situ
method, there is great need for a method to adequately estimate integrated
primary production in the water column which needs no long-term overboard
incubations, but accounts for both factors which decide the vertical distribution of the photosynthesis rate: light attenuation and vertical distribution of
phytoplankton. This requirement is met by the so-called calculative or Ks
method, which I recommend for use and which is described below in more
detail.
2.3.3.2 Ks Calculative Method
This method was developed in 1955 for measurement integrated primary production (Cpt) during short-term standard hydrobiological cruises in the 60 x
100-km Rybinsk reservoir. The schedule of these cruises excluded the possi-