

Technique of Measuring Phytoplankton Primary Production
53
tions in water column. The scientists who invented and used it in the 1950s and
1960s had every right not to worry about this, because at that time profiling
of chlorophyll distribution was not widely in use, and thus the fine layer vertical structure of phytoplankton communities was not considered, although
first evidence did exist (Sorokin 1959b). Now we know more about deep
chlorophyll maxima and dense layers of phytoplankton above the thermocline
of the kinds demonstrated in Figs 2.9 and 2.10. It is therefore now quite
obvious that optimal illumination conditions in the upper layer of the euphotic
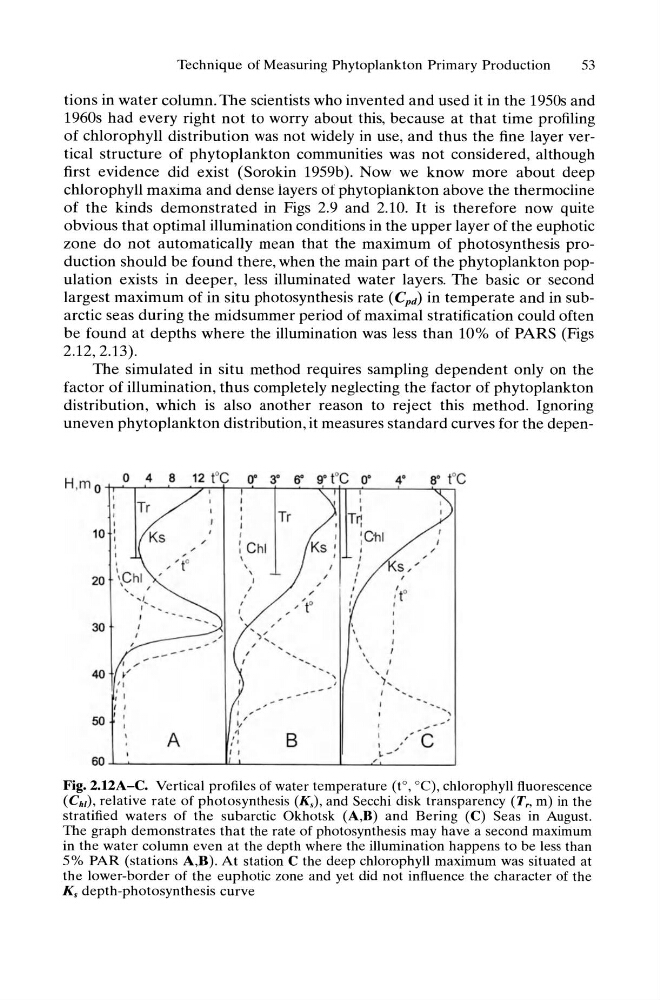
zone do not automatically mean that the maximum of photosynthesis production should be found there, when the main part of the phytoplankton population exists in deeper, less illuminated water layers. The basic or second
largest maximum of in situ photosynthesis rate (Cpd) in temperate and in subarctic seas during the midsummer period of maximal stratification could often
be found at depths where the illumination was less than 10% of PARS (Figs
2.12,2.13).
The simulated in situ method requires sampling dependent only on the
factor of illumination, thus completely neglecting the factor of phytoplankton
distribution, which is also another reason to reject this method. Ignoring
uneven phytoplankton distribution, it measures standard curves for the depenH,m o
0 4 8 12 f C 0" 3' SO
Tr
j
,
Tr
,
j
10
Ks
j
/
: Chi
,
" . . . to
\
S,
,
"Chi
,
\
20
'.......
I
j
,
/
'I, ,
. . . ' " . . . . to
,
j
30
,
,
"
\
" ,
\
\
, ,
\
\
, , I
40
,
"
,
),
,
,
j
I ,
,
,
, ,
~
50
I '
,
,
A
~
B
,." 'c
.
• I
,
, ,
~ -
60
Fig.2.12A-C. Vertical profiles of water temperature (to, DC), chlorophyll fluorescence
(Chi), relative rate of photosynthesis (Ks), and Secchi disk transparency (Tn m) in the
stratified waters of the subarctic Okhotsk (A,B) and Bering (C) Seas in August.
The graph demonstrates that the rate of photosynthesis may have a second maximum
in the water column even at the depth where the illumination happens to be less than
5% PAR (stations A,B). At station C the deep chlorophyll maximum was situated at
the lower-border of the euphotic zone and yet did not influence the character of the
Ks depth-photosynthesis curve
53
tions in water column. The scientists who invented and used it in the 1950s and
1960s had every right not to worry about this, because at that time profiling
of chlorophyll distribution was not widely in use, and thus the fine layer vertical structure of phytoplankton communities was not considered, although
first evidence did exist (Sorokin 1959b). Now we know more about deep
chlorophyll maxima and dense layers of phytoplankton above the thermocline
of the kinds demonstrated in Figs 2.9 and 2.10. It is therefore now quite
obvious that optimal illumination conditions in the upper layer of the euphotic
zone do not automatically mean that the maximum of photosynthesis production should be found there, when the main part of the phytoplankton population exists in deeper, less illuminated water layers. The basic or second
largest maximum of in situ photosynthesis rate (Cpd) in temperate and in subarctic seas during the midsummer period of maximal stratification could often
be found at depths where the illumination was less than 10% of PARS (Figs
2.12,2.13).
The simulated in situ method requires sampling dependent only on the
factor of illumination, thus completely neglecting the factor of phytoplankton
distribution, which is also another reason to reject this method. Ignoring
uneven phytoplankton distribution, it measures standard curves for the depenH,m o
0 4 8 12 f C 0" 3' SO
Tr
j
,
Tr
,
j
10
Ks
j
/
: Chi
,
" . . . to
\
S,
,
"Chi
,
\
20
'.......
I
j
,
/
'I, ,
. . . ' " . . . . to
,
j
30
,
,
"
\
" ,
\
\
, ,
\
\
, , I
40
,
"
,
),
,
,
j
I ,
,
,
, ,
~
50
I '
,
,
A
~
B
,." 'c
.
• I
,
, ,
~ -
60
Fig.2.12A-C. Vertical profiles of water temperature (to, DC), chlorophyll fluorescence
(Chi), relative rate of photosynthesis (Ks), and Secchi disk transparency (Tn m) in the
stratified waters of the subarctic Okhotsk (A,B) and Bering (C) Seas in August.
The graph demonstrates that the rate of photosynthesis may have a second maximum
in the water column even at the depth where the illumination happens to be less than
5% PAR (stations A,B). At station C the deep chlorophyll maximum was situated at
the lower-border of the euphotic zone and yet did not influence the character of the
Ks depth-photosynthesis curve