

19 Detection of Land Cover Change
431
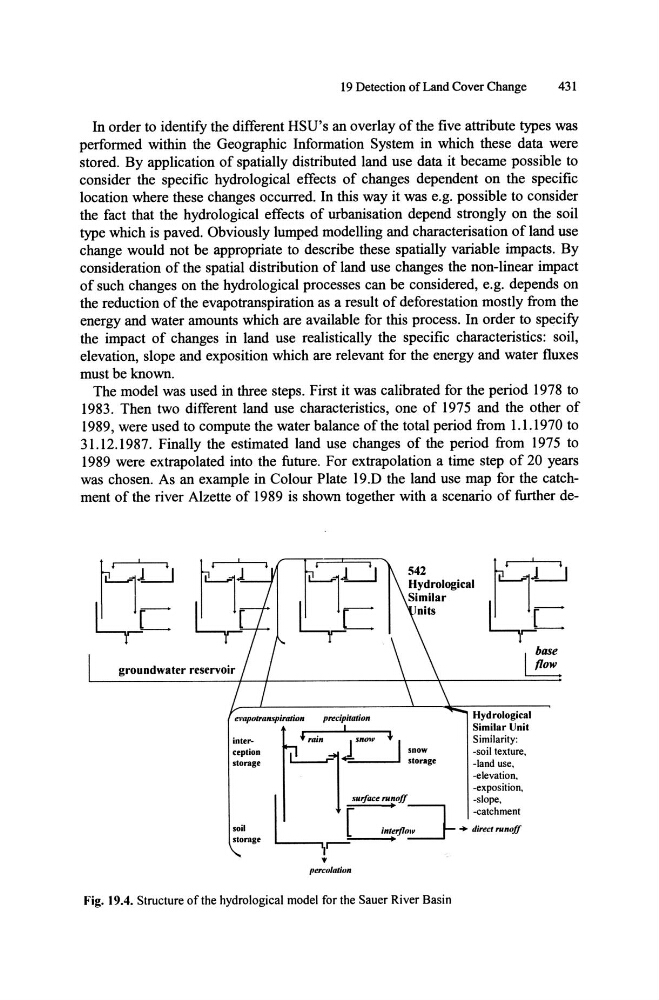
In order to identify the different HSU's an overlay of the five attribute types was
performed within the Geographic Information System in which these data were
stored. By application of spatially distributed land use data it became possible to
consider the specific hydrological effects of changes dependent on the specific
location where these changes occurred. In this way it was e.g. possible to consider
the fact that the hydrological effects of urbanisation depend strongly on the soil
type which is paved. Obviously lumped modelling and characterisation of land use
change would not be appropriate to describe these spatially variable impacts. By
consideration of the spatial distribution of land use changes the non-linear impact
of such changes on the hydrological processes can be considered, e.g. depends on
the reduction of the evapotranspiration as a result of deforestation mostly from the
energy and water amounts which are available for this process. In order to specify
the impact of changes in land use realistically the specific characteristics: soil,
elevation, slope and exposition which are relevant for the energy and water fluxes
must be known.
The model was used in three steps. First it was calibrated for the period 1978 to
1983. Then two different land use characteristics, one of 1975 and the other of
1989, were used to compute the water balance of the total period from 1.1.1970 to
31.12.1987. Finally the estimated land use changes of the period from 1975 to
1989 were extrapolated into the future. For extrapolation a time step of 20 years
was chosen. As an example in Colour Plate 19.D the land use map for the catchment of the river Alzette of 1989 is shown together with a scenario of further degroundwater reservoir
I base flow
evapoIranspimtion
precipillltion
Hydrological
inle ....
ception
storage
soil
I
Similar Unit
1'-TC '1-· s:::=..
~---' storage
-land use,
-elevation,
-exposition.
l, [
SIIrftu:e "';"'ff ~
:~~::nent
inteljl~ .. direct ",noff
storage
r--=----.
"
percolation
Fig. 19.4. Structure of the hydrological model for the Sauer River Basin
431
In order to identify the different HSU's an overlay of the five attribute types was
performed within the Geographic Information System in which these data were
stored. By application of spatially distributed land use data it became possible to
consider the specific hydrological effects of changes dependent on the specific
location where these changes occurred. In this way it was e.g. possible to consider
the fact that the hydrological effects of urbanisation depend strongly on the soil
type which is paved. Obviously lumped modelling and characterisation of land use
change would not be appropriate to describe these spatially variable impacts. By
consideration of the spatial distribution of land use changes the non-linear impact
of such changes on the hydrological processes can be considered, e.g. depends on
the reduction of the evapotranspiration as a result of deforestation mostly from the
energy and water amounts which are available for this process. In order to specify
the impact of changes in land use realistically the specific characteristics: soil,
elevation, slope and exposition which are relevant for the energy and water fluxes
must be known.
The model was used in three steps. First it was calibrated for the period 1978 to
1983. Then two different land use characteristics, one of 1975 and the other of
1989, were used to compute the water balance of the total period from 1.1.1970 to
31.12.1987. Finally the estimated land use changes of the period from 1975 to
1989 were extrapolated into the future. For extrapolation a time step of 20 years
was chosen. As an example in Colour Plate 19.D the land use map for the catchment of the river Alzette of 1989 is shown together with a scenario of further degroundwater reservoir
I base flow
evapoIranspimtion
precipillltion
Hydrological
inle ....
ception
storage
soil
I
Similar Unit
1'-TC '1-· s:::=..
~---' storage
-land use,
-elevation,
-exposition.
l, [
SIIrftu:e "';"'ff ~
:~~::nent
inteljl~ .. direct ",noff
storage
r--=----.
"
percolation
Fig. 19.4. Structure of the hydrological model for the Sauer River Basin