

19 Detection of Land Cover Change
427
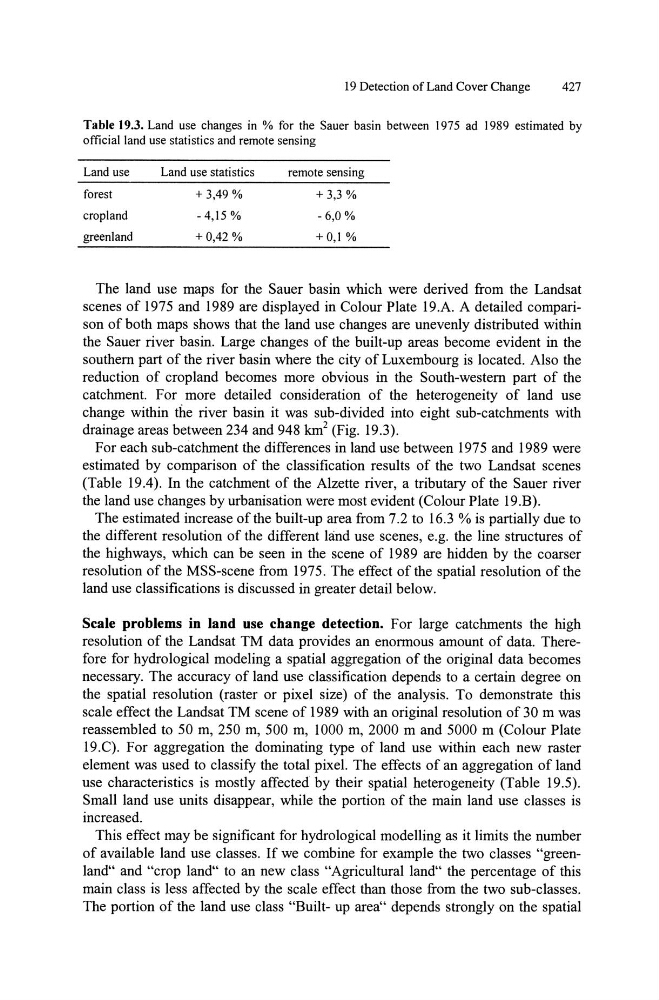
Table 19.3. Land use changes in % for the Sauer basin between 1975 ad 1989 estimated by
officia11and use statistics and remote sensing
Land use
forest
cropland
greenland
Land use statistics
+ 3,49 %
-4,15 %
+ 0,42 %
remote sensing
+3,3 %
-6,0%
+0,1 %
The land use maps for the Sauer basin which were derived from the Landsat
scenes of 1975 and 1989 are displayed in Colour Plate 19.A. A detailed comparison of both maps shows that the land use changes are unevenly distributed within
the Sauer river basin. Large changes of the built-up areas become evident in the
southern part of the river basin where the city of Luxembourg is located. Also the
reduction of cropland becomes more obvious in the South-western part of the
catchment. For more detailed consideration of the heterogeneity of land use
change within the river basin it was sub-divided into eight sub-catchments with
drainage areas between 234 and 948 km 2 (Fig. 19.3).
For each sub-catchment the differences in land use between 1975 and 1989 were
estimated by comparison of the classification results of the two Landsat scenes
(Table 19.4). In the catchment of the Alzette river, a tributary of the Sauer river
the land use changes by urbanisation were most evident (Colour Plate 19.B).
The estimated increase of the built-up area from 7.2 to 16.3 % is partially due to
the different resolution of the different hind use scenes, e.g. the line structures of
the highways, which can be seen in the scene of 1989 are hidden by the coarser
resolution of the MSS-scene from 1975. The effect of the spatial resolution of the
land use classifications is discussed in greater detail below.
Scale problems in land use change detection. For large catchments the high
resolution of the Landsat TM data provides an enormous amount of data. Therefore for hydrological modeling a spatial aggregation of the original data becomes
necessary. The accuracy of land use classification depends to a certain degree on
the spatial resolution (raster or pixel size) of the analysis. To demonstrate this
scale effect the Landsat TM scene of 1989 with an original resolution of 30 m was
reassembled to 50 m, 250 m, 500 m, 1000 m, 2000 m and 5000 m (Colour Plate
19.C). For aggregation the dominating type of land use within each new raster
element was used to classify the total pixel. The effects of an aggregation of land
use characteristics is mostly affected by their spatial heterogeneity (Table 19.5).
Small land use units disappear, while the portion of the main land use classes is
increased.
This effect may be significant for hydrological modelling as it limits the number
of available land use classes. If we combine for example the two classes "greenland" and "crop land" to an new class "Agricultural land" the percentage of this
main class is less affected by the scale effect than those from the two sub-classes.
The portion of the land use class "Built- up area" depends strongly on the spatial
427
Table 19.3. Land use changes in % for the Sauer basin between 1975 ad 1989 estimated by
officia11and use statistics and remote sensing
Land use
forest
cropland
greenland
Land use statistics
+ 3,49 %
-4,15 %
+ 0,42 %
remote sensing
+3,3 %
-6,0%
+0,1 %
The land use maps for the Sauer basin which were derived from the Landsat
scenes of 1975 and 1989 are displayed in Colour Plate 19.A. A detailed comparison of both maps shows that the land use changes are unevenly distributed within
the Sauer river basin. Large changes of the built-up areas become evident in the
southern part of the river basin where the city of Luxembourg is located. Also the
reduction of cropland becomes more obvious in the South-western part of the
catchment. For more detailed consideration of the heterogeneity of land use
change within the river basin it was sub-divided into eight sub-catchments with
drainage areas between 234 and 948 km 2 (Fig. 19.3).
For each sub-catchment the differences in land use between 1975 and 1989 were
estimated by comparison of the classification results of the two Landsat scenes
(Table 19.4). In the catchment of the Alzette river, a tributary of the Sauer river
the land use changes by urbanisation were most evident (Colour Plate 19.B).
The estimated increase of the built-up area from 7.2 to 16.3 % is partially due to
the different resolution of the different hind use scenes, e.g. the line structures of
the highways, which can be seen in the scene of 1989 are hidden by the coarser
resolution of the MSS-scene from 1975. The effect of the spatial resolution of the
land use classifications is discussed in greater detail below.
Scale problems in land use change detection. For large catchments the high
resolution of the Landsat TM data provides an enormous amount of data. Therefore for hydrological modeling a spatial aggregation of the original data becomes
necessary. The accuracy of land use classification depends to a certain degree on
the spatial resolution (raster or pixel size) of the analysis. To demonstrate this
scale effect the Landsat TM scene of 1989 with an original resolution of 30 m was
reassembled to 50 m, 250 m, 500 m, 1000 m, 2000 m and 5000 m (Colour Plate
19.C). For aggregation the dominating type of land use within each new raster
element was used to classify the total pixel. The effects of an aggregation of land
use characteristics is mostly affected by their spatial heterogeneity (Table 19.5).
Small land use units disappear, while the portion of the main land use classes is
increased.
This effect may be significant for hydrological modelling as it limits the number
of available land use classes. If we combine for example the two classes "greenland" and "crop land" to an new class "Agricultural land" the percentage of this
main class is less affected by the scale effect than those from the two sub-classes.
The portion of the land use class "Built- up area" depends strongly on the spatial