

426
AH. Schumann and G.A Schultz
Table 19.2. Land use classification results (in %) of four Landsat scenes for the Sauer River
Basin (4259 km 2 )
MSS scene
MSS scene
TM scene
TM scene
Land use class
212125 on
212125 on
197/25 on
197/25 on
29.08.1975
20.08.1980
22.08.1984
20.08.1989
Water
0.1
0.1
0.1
0.1
Built-up Area
2.9
4.3
5.5
5.8
Coniferous Forest
8.7
6.9
5.9
8.5
Deciduous Forest
15.7
13.5
19.7
17.4
Mixed Forest
8.8
14.5
9.7
10.6
Crop Land
28.6
24.1
21.7
22.6
Greenland
32.3
33.7
34.7
32.2
Park and Garden etc.
2.9
2.8
2.7
2.9
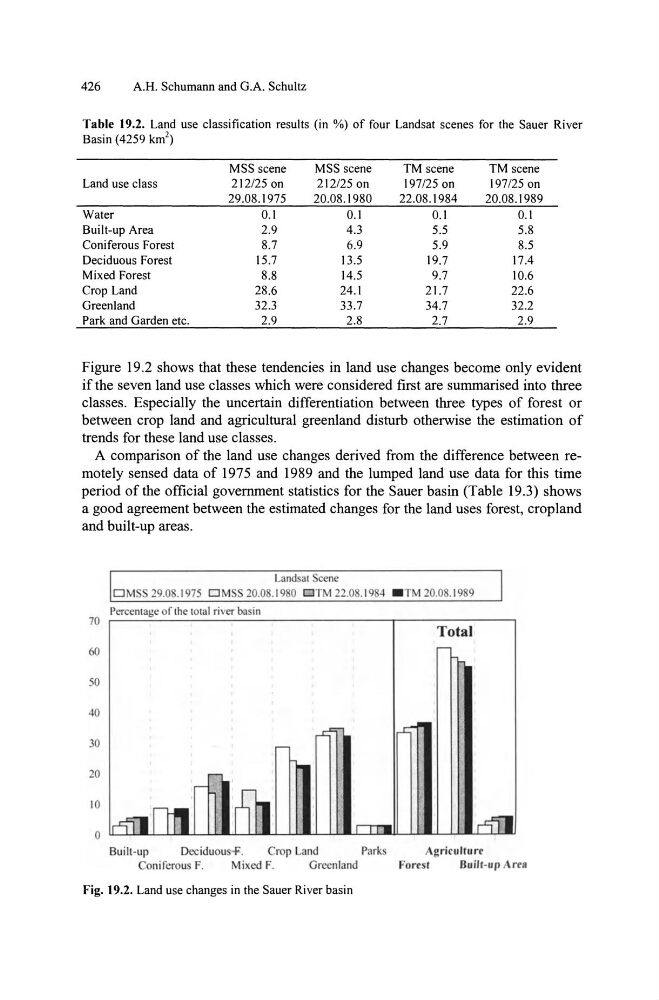
Figure 19.2 shows that these tendencies in land use changes become only evident
if the seven land use classes which were considered first are summarised into three
classes. Especially the uncertain differentiation between three types of forest or
between crop land and agricultural greenland disturb otherwise the estimation of
trends for these land use classes.
A comparison of the land use changes derived from the difference between remotely sensed data of 1975 and 1989 and the lumped land use data for this time
period of the official government statistics for the Sauer basin (Table 19.3) shows
a good agreement between the estimated changes for the land uses forest, cropland
and built-up areas.
Landsat Scene
29.08.1975 DM 20.08.1980 DTM 22.08. 1984 . TM 20.08. 1989
Percentage of the total river basin
70
60
50
40
30
20
10
o
Fig. 19.2. Land use changes in the Sauer River basin
Total
AH. Schumann and G.A Schultz
Table 19.2. Land use classification results (in %) of four Landsat scenes for the Sauer River
Basin (4259 km 2 )
MSS scene
MSS scene
TM scene
TM scene
Land use class
212125 on
212125 on
197/25 on
197/25 on
29.08.1975
20.08.1980
22.08.1984
20.08.1989
Water
0.1
0.1
0.1
0.1
Built-up Area
2.9
4.3
5.5
5.8
Coniferous Forest
8.7
6.9
5.9
8.5
Deciduous Forest
15.7
13.5
19.7
17.4
Mixed Forest
8.8
14.5
9.7
10.6
Crop Land
28.6
24.1
21.7
22.6
Greenland
32.3
33.7
34.7
32.2
Park and Garden etc.
2.9
2.8
2.7
2.9
Figure 19.2 shows that these tendencies in land use changes become only evident
if the seven land use classes which were considered first are summarised into three
classes. Especially the uncertain differentiation between three types of forest or
between crop land and agricultural greenland disturb otherwise the estimation of
trends for these land use classes.
A comparison of the land use changes derived from the difference between remotely sensed data of 1975 and 1989 and the lumped land use data for this time
period of the official government statistics for the Sauer basin (Table 19.3) shows
a good agreement between the estimated changes for the land uses forest, cropland
and built-up areas.
Landsat Scene
29.08.1975 DM 20.08.1980 DTM 22.08. 1984 . TM 20.08. 1989
Percentage of the total river basin
70
60
50
40
30
20
10
o
Fig. 19.2. Land use changes in the Sauer River basin
Total