

19 Detection of Land Cover Change
425
Table 19.1. Landsat scenes used in the Sauer River Study
Scene Centre
Satellite/Sensor
Acquisition
Date
Latitude (North)
Longitude (East)
Landsat 2/MSSI
29.08.75
50°14'
Landsat 3/MSS
13.05.80
50°16'
Landsat 5/TM 2
30.07.84
50°28'
Landsat 5/TM
22.08.84
50°28'
Landsat 5/TM
25.05.89
50°28'
Landsat 5/TM
20.08.89
50°28'
Landsat 5/TM
17.11.89
50°17'
Landsat 5/TM
24.05.92
50°28'
1: MSS = Multispectral Scanner; 2: TM = Thematic Mapper
6°35'
6°25'
7°46'
5°84'
7°46'
5°92'
7°50'
5°92'
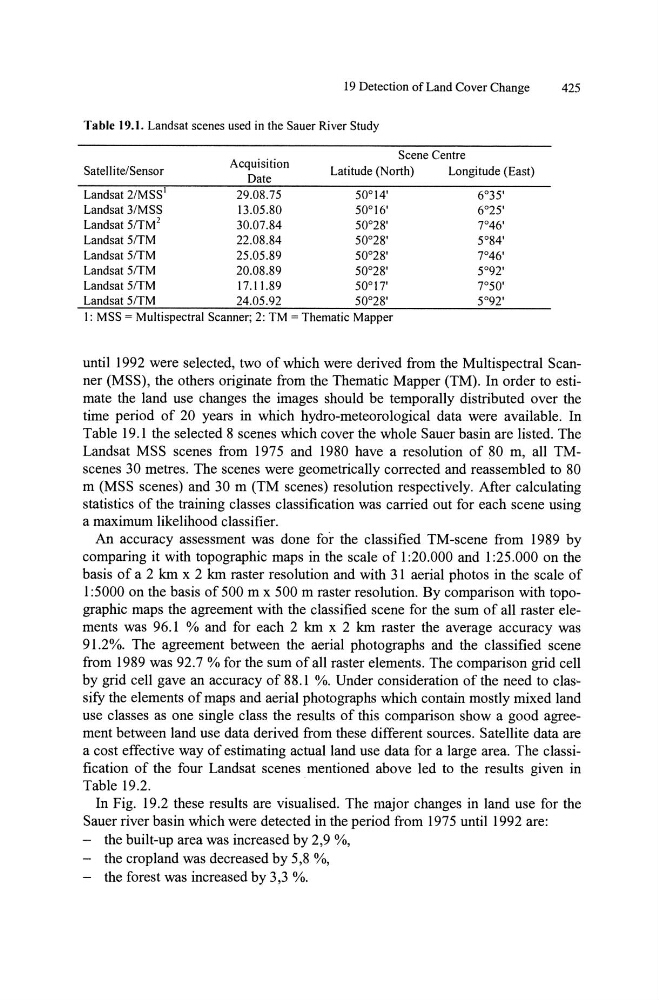
until 1992 were selected, two of which were derived from the Multispectral Scanner (MSS), the others originate from the Thematic Mapper (TM). In order to estimate the land use changes the images should be temporally distributed over the
time period of 20 years in which hydro-meteorological data were available. In
Table 19.1 the selected 8 scenes which cover the whole Sauer basin are listed. The
Landsat MSS scenes from 1975 and 1980 have a resolution of 80 m, all TMscenes 30 metres. The scenes were geometrically corrected and reassembled to 80
m (MSS scenes) and 30 m (TM scenes) resolution respectively. After calculating
statistics of the training classes classification was carried out for each scene using
a maximum likelihood classifier.
An accuracy assessment was done for the classified TM-scene from 1989 by
comparing it with topographic maps in the scale of 1 :20.000 and 1 :25.000 on the
basis of a 2 km x 2 km raster resolution and with 31 aerial photos in the scale of
1 :5000 on the basis of 500 m x 500 m raster resolution. By comparison with topographic maps the agreement with the classified scene for the sum of all raster elements was 96.1 % and for each 2 km x 2 km raster the average accuracy was
91.2%. The agreement between the aerial photographs and the classified scene
from 1989 was 92.7 % for the sum of all raster elements. The comparison grid cell
by grid cell gave an accuracy of 88.1 %. Under consideration of the need to clas~
sify the elements of maps and aerial photographs which contain mostly mixed land
use classes as one single class the results of this comparison show a good agreement between land use data derived from these different sources. Satellite data are
a cost effective way of estimating actual land use data for a large area. The classification of the four Landsat scenes mentioned above led to the results given in
Table 19.2.
In Fig. 19.2 these results are visualised. The major changes in land use for the
Sauer river basin which were detected in the period from 1975 until 1992 are:
the built-up area was increased by 2,9 %,
the cropland was decreased by 5,8 %,
the forest was increased by 3,3 %.
425
Table 19.1. Landsat scenes used in the Sauer River Study
Scene Centre
Satellite/Sensor
Acquisition
Date
Latitude (North)
Longitude (East)
Landsat 2/MSSI
29.08.75
50°14'
Landsat 3/MSS
13.05.80
50°16'
Landsat 5/TM 2
30.07.84
50°28'
Landsat 5/TM
22.08.84
50°28'
Landsat 5/TM
25.05.89
50°28'
Landsat 5/TM
20.08.89
50°28'
Landsat 5/TM
17.11.89
50°17'
Landsat 5/TM
24.05.92
50°28'
1: MSS = Multispectral Scanner; 2: TM = Thematic Mapper
6°35'
6°25'
7°46'
5°84'
7°46'
5°92'
7°50'
5°92'
until 1992 were selected, two of which were derived from the Multispectral Scanner (MSS), the others originate from the Thematic Mapper (TM). In order to estimate the land use changes the images should be temporally distributed over the
time period of 20 years in which hydro-meteorological data were available. In
Table 19.1 the selected 8 scenes which cover the whole Sauer basin are listed. The
Landsat MSS scenes from 1975 and 1980 have a resolution of 80 m, all TMscenes 30 metres. The scenes were geometrically corrected and reassembled to 80
m (MSS scenes) and 30 m (TM scenes) resolution respectively. After calculating
statistics of the training classes classification was carried out for each scene using
a maximum likelihood classifier.
An accuracy assessment was done for the classified TM-scene from 1989 by
comparing it with topographic maps in the scale of 1 :20.000 and 1 :25.000 on the
basis of a 2 km x 2 km raster resolution and with 31 aerial photos in the scale of
1 :5000 on the basis of 500 m x 500 m raster resolution. By comparison with topographic maps the agreement with the classified scene for the sum of all raster elements was 96.1 % and for each 2 km x 2 km raster the average accuracy was
91.2%. The agreement between the aerial photographs and the classified scene
from 1989 was 92.7 % for the sum of all raster elements. The comparison grid cell
by grid cell gave an accuracy of 88.1 %. Under consideration of the need to clas~
sify the elements of maps and aerial photographs which contain mostly mixed land
use classes as one single class the results of this comparison show a good agreement between land use data derived from these different sources. Satellite data are
a cost effective way of estimating actual land use data for a large area. The classification of the four Landsat scenes mentioned above led to the results given in
Table 19.2.
In Fig. 19.2 these results are visualised. The major changes in land use for the
Sauer river basin which were detected in the period from 1975 until 1992 are:
the built-up area was increased by 2,9 %,
the cropland was decreased by 5,8 %,
the forest was increased by 3,3 %.