

8 Evaporation
173
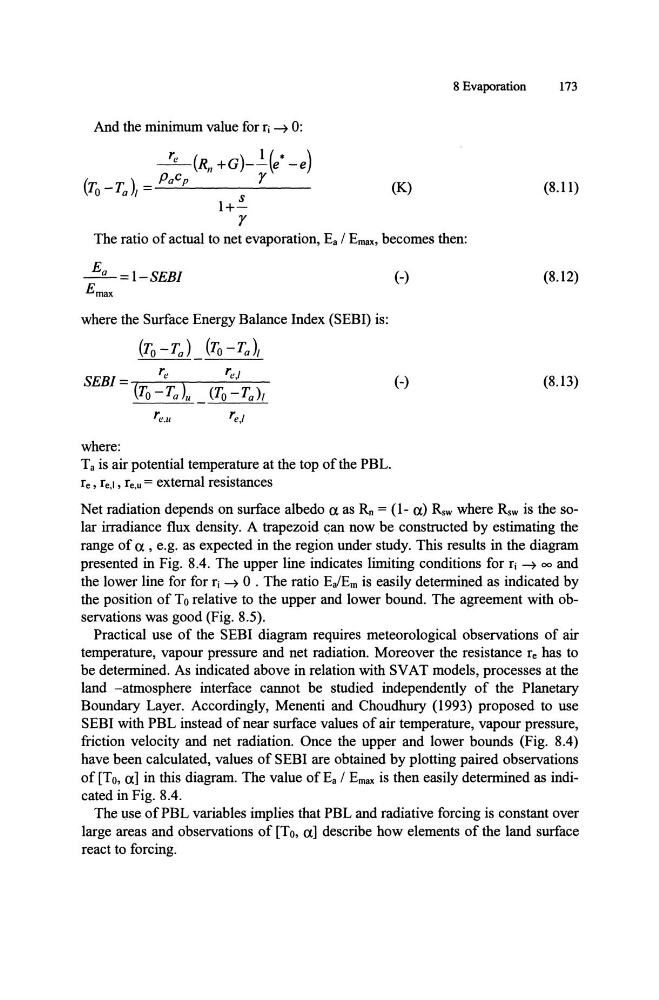
And the minimum value for rj ~ 0:
re (
) 1 ( * )
--Rn+G --e-e
( r;_T)=Pa cp
r
o a,
S
1+(K)
(8.11 )
r
The ratio of actual to net evaporation, Ea / Emax, becomes then:
~=l-SEBf
Ernax
where the Surface Energy Balance Index (SEBI) is:
(To - Ta ) (To - Ta ),
re
SEBf = (r; - T )
o a u
where:
T a is air potential temperature at the top of the PBL.
re, re,1 , re,U = external resistances
(-)
(8.12)
(-)
(8.13)
Net radiation depends on surface albedo a as Rn = (1- a) Rsw where Rsw is the solar irradiance flux density. A trapezoid can now be constructed by estimating the
range of a , e.g. as expected in the region under study. This results in the diagram
presented in Fig. 8.4. The upper line indicates limiting conditions for rj ~ 00 and
the lower line for for rj ~ 0 . The ratio Ea/Em is easily determined as indicated by
the position of To relative to the upper and lower bound. The agreement with observations was good (Fig. 8.5).
Practical use of the SEBI diagram requires meteorological observations of air
temperature, vapour pressure and net radiation. Moreover the resistance re has to
be determined. As indicated above in relation with SVAT models, processes at the
land -atmosphere interface cannot be studied independently of the Planetary
Boundary Layer. Accordingly, Menenti and Choudhury (1993) proposed to use
SEBI with PBL instead of near surface values of air temperature, vapour pressure,
friction velocity and net radiation. Once the upper and lower bounds (Fig. 8.4)
have been calculated, values of SEBI are obtained by plotting paired observations
of [To, a] in this diagram. The value of Ea / Emax is then easily determined as indicated in Fig. 8.4.
The ~se ofPBL variables implies that PBL and radiative forcing is constant over
large areas and observations of [To, a] describe how elements of the land surface
react to forcing.
173
And the minimum value for rj ~ 0:
re (
) 1 ( * )
--Rn+G --e-e
( r;_T)=Pa cp
r
o a,
S
1+(K)
(8.11 )
r
The ratio of actual to net evaporation, Ea / Emax, becomes then:
~=l-SEBf
Ernax
where the Surface Energy Balance Index (SEBI) is:
(To - Ta ) (To - Ta ),
re
SEBf = (r; - T )
o a u
where:
T a is air potential temperature at the top of the PBL.
re, re,1 , re,U = external resistances
(-)
(8.12)
(-)
(8.13)
Net radiation depends on surface albedo a as Rn = (1- a) Rsw where Rsw is the solar irradiance flux density. A trapezoid can now be constructed by estimating the
range of a , e.g. as expected in the region under study. This results in the diagram
presented in Fig. 8.4. The upper line indicates limiting conditions for rj ~ 00 and
the lower line for for rj ~ 0 . The ratio Ea/Em is easily determined as indicated by
the position of To relative to the upper and lower bound. The agreement with observations was good (Fig. 8.5).
Practical use of the SEBI diagram requires meteorological observations of air
temperature, vapour pressure and net radiation. Moreover the resistance re has to
be determined. As indicated above in relation with SVAT models, processes at the
land -atmosphere interface cannot be studied independently of the Planetary
Boundary Layer. Accordingly, Menenti and Choudhury (1993) proposed to use
SEBI with PBL instead of near surface values of air temperature, vapour pressure,
friction velocity and net radiation. Once the upper and lower bounds (Fig. 8.4)
have been calculated, values of SEBI are obtained by plotting paired observations
of [To, a] in this diagram. The value of Ea / Emax is then easily determined as indicated in Fig. 8.4.
The ~se ofPBL variables implies that PBL and radiative forcing is constant over
large areas and observations of [To, a] describe how elements of the land surface
react to forcing.