

4. Dry Bare
~ ________________ ~ ___________ S ~Oi~
5
10
15
20
25
Surface-Air Temperatu re (0C)
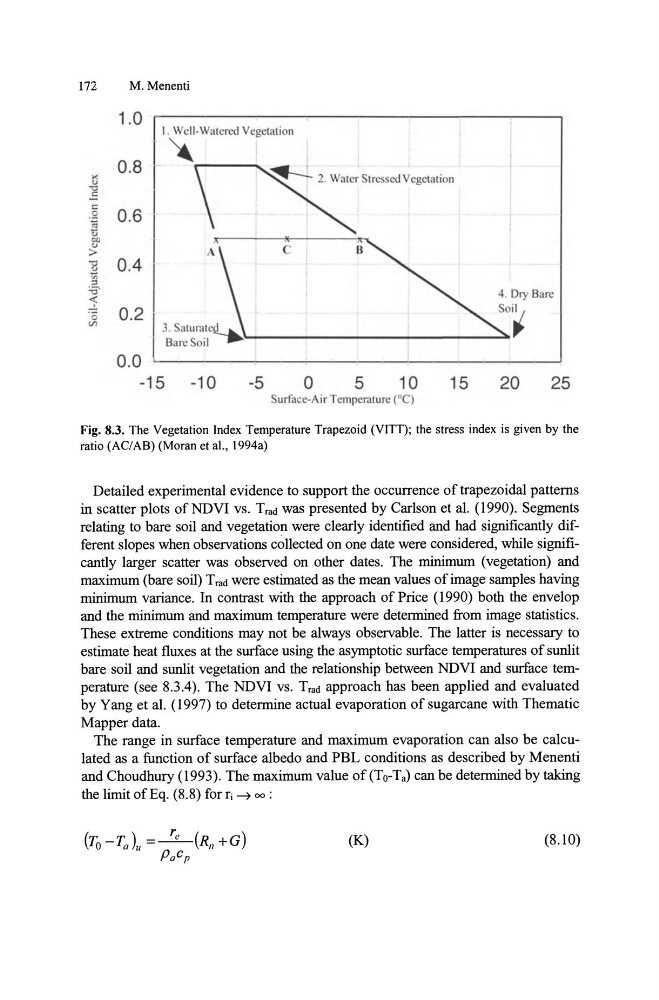
Fig. 8.3. The Vegetation Index Temperature Trapezoid (VITI); the stress index is given by the
ratio (AC/ AB) (Moran et aI., 1994a)
Detailed experimental evidence to support the occurrence of trapezoidal patterns
in scatter plots ofNDVI vs. Trad was presented by Carlson et al. (1990). Segments
relating to bare soil and vegetation were clearly identified and had significantly different slopes when observations collected on one date were considered, while significantly larger scatter was observed on other dates. The minimum (vegetation) and
maximum (bare soil) T rad were estimated as the mean values of image samples having
minimum variance. In contrast with the approach of Price (1990) both the envelop
and the minimum and maximum temperature were determined from image statistics.
These extreme conditions may not be always observable. The latter is necessary to
estimate heat fluxes at the surface using the asymptotic surface temperatures of sunlit
bare soil and sunlit vegetation and the relationship between NDVI and surface temperature (see 8.3.4). The NDVI vs. Trad approach has been applied and evaluated
by Yang et al. (1997) to detennine actual evaporation of sugarcane with Thematic
Mapper data.
The range in surface temperature and maximum evaporation can also be calculated as a function of surface albedo and PBL conditions as described by Menenti
and Choudhury (1993). The maximum value of (To-Ta) can be determined by taking
the limit ofEq. (8.8) for rj ~ 00 :
(K)
(8.10)
~ ________________ ~ ___________ S ~Oi~
5
10
15
20
25
Surface-Air Temperatu re (0C)
Fig. 8.3. The Vegetation Index Temperature Trapezoid (VITI); the stress index is given by the
ratio (AC/ AB) (Moran et aI., 1994a)
Detailed experimental evidence to support the occurrence of trapezoidal patterns
in scatter plots ofNDVI vs. Trad was presented by Carlson et al. (1990). Segments
relating to bare soil and vegetation were clearly identified and had significantly different slopes when observations collected on one date were considered, while significantly larger scatter was observed on other dates. The minimum (vegetation) and
maximum (bare soil) T rad were estimated as the mean values of image samples having
minimum variance. In contrast with the approach of Price (1990) both the envelop
and the minimum and maximum temperature were determined from image statistics.
These extreme conditions may not be always observable. The latter is necessary to
estimate heat fluxes at the surface using the asymptotic surface temperatures of sunlit
bare soil and sunlit vegetation and the relationship between NDVI and surface temperature (see 8.3.4). The NDVI vs. Trad approach has been applied and evaluated
by Yang et al. (1997) to detennine actual evaporation of sugarcane with Thematic
Mapper data.
The range in surface temperature and maximum evaporation can also be calculated as a function of surface albedo and PBL conditions as described by Menenti
and Choudhury (1993). The maximum value of (To-Ta) can be determined by taking
the limit ofEq. (8.8) for rj ~ 00 :
(K)
(8.10)