

Vorticity
75
z
x
u(z)
ω 1
vortex line at t = 0
vortex line at t > 0
Figure 4.3. Illustration of vortex tilting. The vortex line is aligned with the z−axis at t = 0 and
is tilted by the vertical shear in the flow. This induces a nonzero x-component of the vorticity (ω1).
z but at different horizontal positions x, say at x 1 and x 2 (with x 2 >x 1 ).
z
x
isopycnals
isobars
x 1
x 2
ρ p
ρ
p
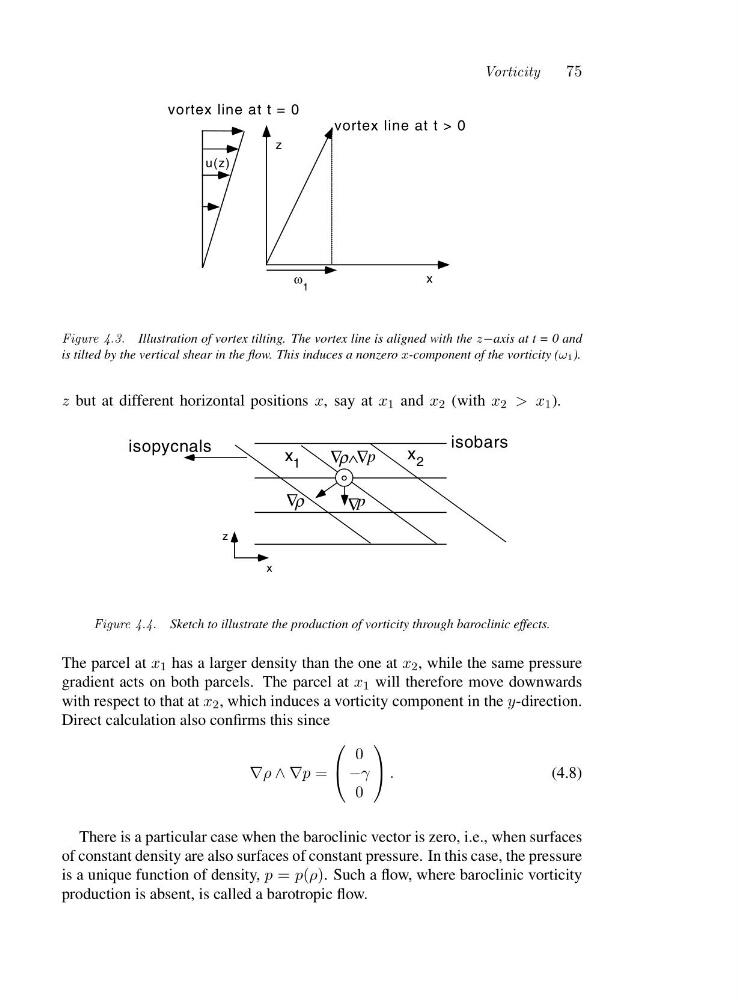
Figure 4.4. Sketch to illustrate the production of vorticity through baroclinic effects.
The parcel at x 1 has a larger density than the one at x 2 , while the same pressure
gradient acts on both parcels. The parcel at x 1 will therefore move downwards
with respect to that at x 2 , which induces a vorticity component in the y-direction.
Direct calculation also confirms this since
∇ρ ∧∇p =
⎛
⎝
0
−γ
0
⎞
⎠ .
(4.8)
There is a particular case when the baroclinic vector is zero, i.e., when surfaces
of constant density are also surfaces of constant pressure. In this case, the pressure
is a unique function of density, p = p(ρ). Such a flow, where baroclinic vorticity
production is absent, is called a barotropic flow.
75
z
x
u(z)
ω 1
vortex line at t = 0
vortex line at t > 0
Figure 4.3. Illustration of vortex tilting. The vortex line is aligned with the z−axis at t = 0 and
is tilted by the vertical shear in the flow. This induces a nonzero x-component of the vorticity (ω1).
z but at different horizontal positions x, say at x 1 and x 2 (with x 2 >x 1 ).
z
x
isopycnals
isobars
x 1
x 2
ρ p
ρ
p
Figure 4.4. Sketch to illustrate the production of vorticity through baroclinic effects.
The parcel at x 1 has a larger density than the one at x 2 , while the same pressure
gradient acts on both parcels. The parcel at x 1 will therefore move downwards
with respect to that at x 2 , which induces a vorticity component in the y-direction.
Direct calculation also confirms this since
∇ρ ∧∇p =
⎛
⎝
0
−γ
0
⎞
⎠ .
(4.8)
There is a particular case when the baroclinic vector is zero, i.e., when surfaces
of constant density are also surfaces of constant pressure. In this case, the pressure
is a unique function of density, p = p(ρ). Such a flow, where baroclinic vorticity
production is absent, is called a barotropic flow.