

Present ocean circulation
37
few estimates at certain locations have been obtained. Recent inversion studies of
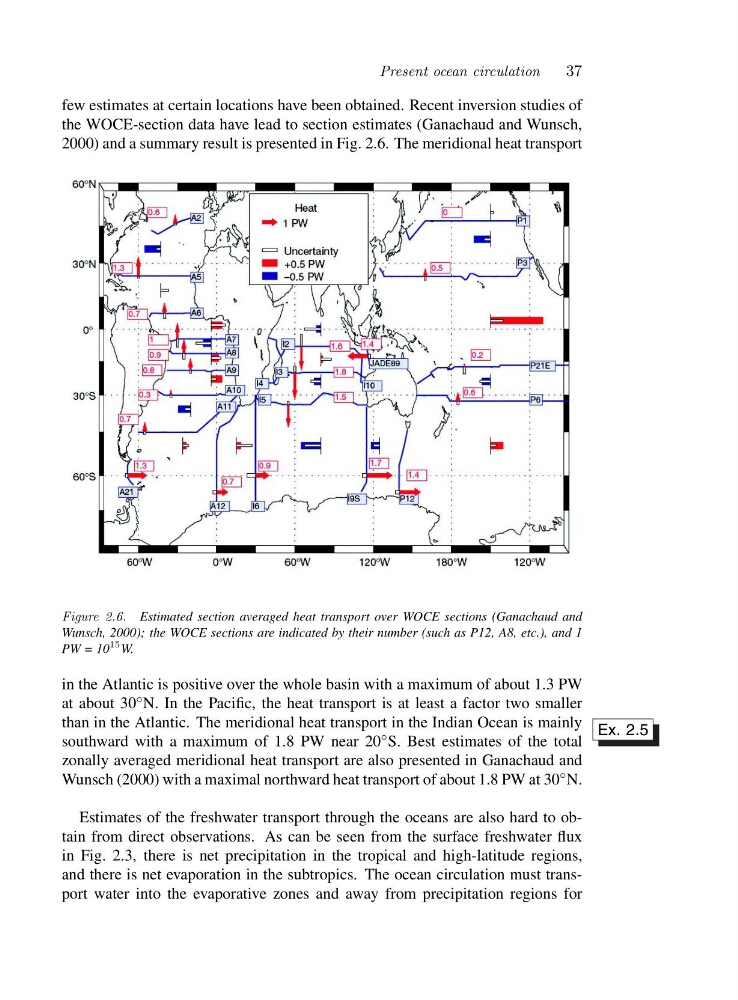
the WOCE-section data have lead to section estimates (Ganachaud and Wunsch,
2000) and a summary result is presented in Fig. 2.6. The meridional heat transport
Figure 2.6. Estimated section averaged heat transport over WOCE sections (Ganachaud and
Wunsch, 2000); the WOCE sections are indicated by their number (such as P12, A8, etc.), and 1
PW = 10
15 W.
in the Atlantic is positive over the whole basin with a maximum of about 1.3 PW
at about 30 ◦ N. In the Pacific, the heat transport is at least a factor two smaller
than in the Atlantic. The meridional heat transport in the Indian Ocean is mainly
southward with a maximum of 1.8 PW near 20 ◦ S. Best estimates of the total
Ex. 2.5
zonally averaged meridional heat transport are also presented in Ganachaud and
Wunsch (2000) with a maximal northward heat transport of about 1.8 PW at 30 ◦ N.
Estimates of the freshwater transport through the oceans are also hard to obtain from direct observations. As can be seen from the surface freshwater flux
in Fig. 2.3, there is net precipitation in the tropical and high-latitude regions,
and there is net evaporation in the subtropics. The ocean circulation must transport water into the evaporative zones and away from precipitation regions for
37
few estimates at certain locations have been obtained. Recent inversion studies of
the WOCE-section data have lead to section estimates (Ganachaud and Wunsch,
2000) and a summary result is presented in Fig. 2.6. The meridional heat transport
Figure 2.6. Estimated section averaged heat transport over WOCE sections (Ganachaud and
Wunsch, 2000); the WOCE sections are indicated by their number (such as P12, A8, etc.), and 1
PW = 10
15 W.
in the Atlantic is positive over the whole basin with a maximum of about 1.3 PW
at about 30 ◦ N. In the Pacific, the heat transport is at least a factor two smaller
than in the Atlantic. The meridional heat transport in the Indian Ocean is mainly
southward with a maximum of 1.8 PW near 20 ◦ S. Best estimates of the total
Ex. 2.5
zonally averaged meridional heat transport are also presented in Ganachaud and
Wunsch (2000) with a maximal northward heat transport of about 1.8 PW at 30 ◦ N.
Estimates of the freshwater transport through the oceans are also hard to obtain from direct observations. As can be seen from the surface freshwater flux
in Fig. 2.3, there is net precipitation in the tropical and high-latitude regions,
and there is net evaporation in the subtropics. The ocean circulation must transport water into the evaporative zones and away from precipitation regions for