

36
DYNAMICAL OCEANOGRAPHY
of the section data of the World Ocean Circulation Experiment (WOCE, see
http://oceanic.cms.udel.edu/woce/), combined with inversion studies have lead to
a more detailed estimates over the volume transports through the world oceans
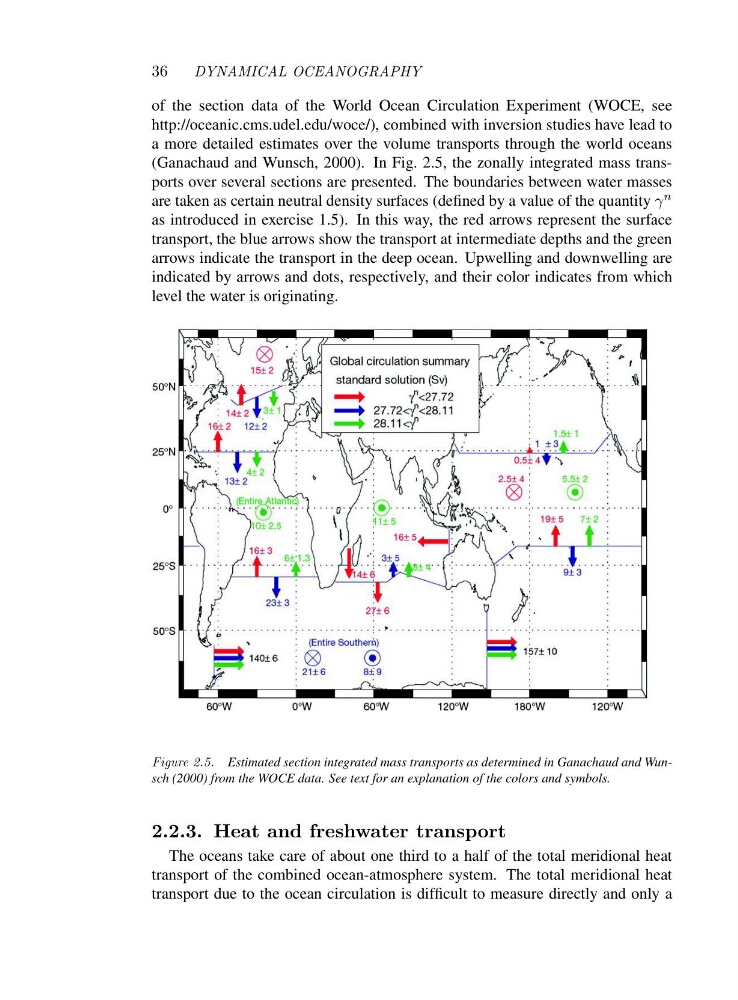
(Ganachaud and Wunsch, 2000). In Fig. 2.5, the zonally integrated mass transports over several sections are presented. The boundaries between water masses
are taken as certain neutral density surfaces (defined by a value of the quantity γ n
as introduced in exercise 1.5). In this way, the red arrows represent the surface
transport, the blue arrows show the transport at intermediate depths and the green
arrows indicate the transport in the deep ocean. Upwelling and downwelling are
indicated by arrows and dots, respectively, and their color indicates from which
level the water is originating.
Figure 2.5. Estimated section integrated mass transports as determined in Ganachaud and Wunsch (2000) from the WOCE data. See text for an explanation of the colors and symbols.
2.2.3. Heat and freshwater transport
The oceans take care of about one third to a half of the total meridional heat
transport of the combined ocean-atmosphere system. The total meridional heat
transport due to the ocean circulation is difficult to measure directly and only a
DYNAMICAL OCEANOGRAPHY
of the section data of the World Ocean Circulation Experiment (WOCE, see
http://oceanic.cms.udel.edu/woce/), combined with inversion studies have lead to
a more detailed estimates over the volume transports through the world oceans
(Ganachaud and Wunsch, 2000). In Fig. 2.5, the zonally integrated mass transports over several sections are presented. The boundaries between water masses
are taken as certain neutral density surfaces (defined by a value of the quantity γ n
as introduced in exercise 1.5). In this way, the red arrows represent the surface
transport, the blue arrows show the transport at intermediate depths and the green
arrows indicate the transport in the deep ocean. Upwelling and downwelling are
indicated by arrows and dots, respectively, and their color indicates from which
level the water is originating.
Figure 2.5. Estimated section integrated mass transports as determined in Ganachaud and Wunsch (2000) from the WOCE data. See text for an explanation of the colors and symbols.
2.2.3. Heat and freshwater transport
The oceans take care of about one third to a half of the total meridional heat
transport of the combined ocean-atmosphere system. The total meridional heat
transport due to the ocean circulation is difficult to measure directly and only a