

378
DYNAMICAL OCEANOGRAPHY
-1 10
5
-8 10
4
-6 10
4
-4 10
4
-2 10
4
0
-45
-40
-35
-30
Time (yr)
δ δ
δ
δ
18 O
cold
warm
Transition
from Eemian
Last Glacial
Maximum
Holocene
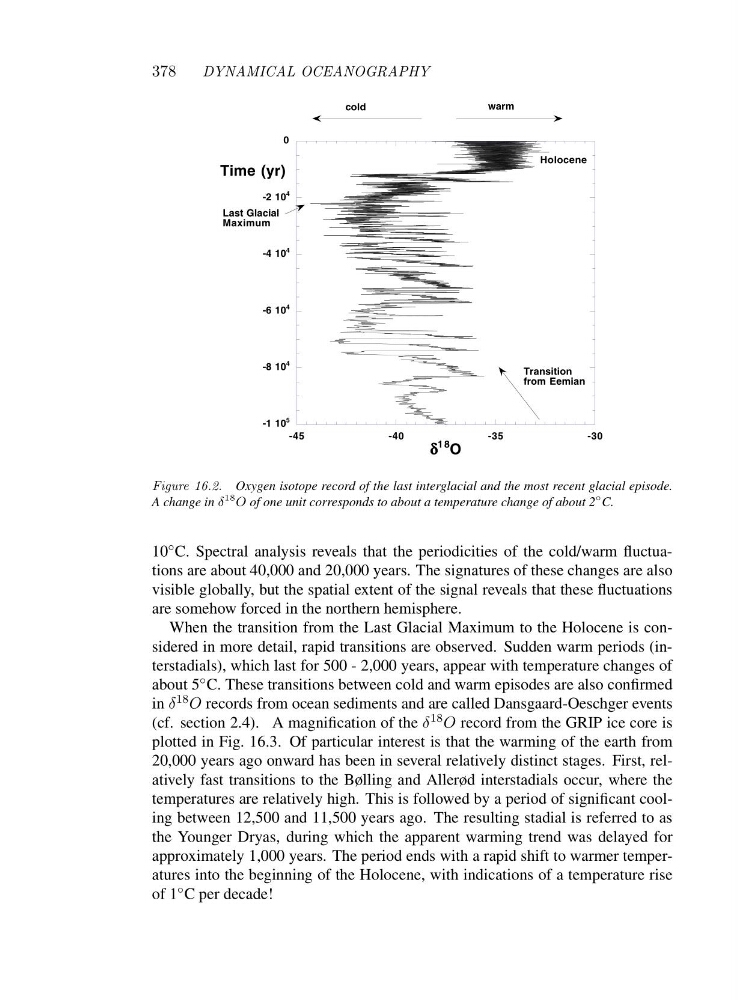
Figure 16.2. Oxygen isotope record of the last interglacial and the most recent glacial episode.
A change in δ
18 O of one unit corresponds to about a temperature change of about 2
◦ C.
10 ◦ C. Spectral analysis reveals that the periodicities of the cold/warm fluctuations are about 40,000 and 20,000 years. The signatures of these changes are also
visible globally, but the spatial extent of the signal reveals that these fluctuations
are somehow forced in the northern hemisphere.
When the transition from the Last Glacial Maximum to the Holocene is considered in more detail, rapid transitions are observed. Sudden warm periods (interstadials), which last for 500 - 2,000 years, appear with temperature changes of
about 5 ◦ C. These transitions between cold and warm episodes are also confirmed
in δ 18 O records from ocean sediments and are called Dansgaard-Oeschger events
(cf. section 2.4). A magnification of the δ 18 O record from the GRIP ice core is
plotted in Fig. 16.3. Of particular interest is that the warming of the earth from
20,000 years ago onward has been in several relatively distinct stages. First, relatively fast transitions to the Bølling and Allerød interstadials occur, where the
temperatures are relatively high. This is followed by a period of significant cooling between 12,500 and 11,500 years ago. The resulting stadial is referred to as
the Younger Dryas, during which the apparent warming trend was delayed for
approximately 1,000 years. The period ends with a rapid shift to warmer temperatures into the beginning of the Holocene, with indications of a temperature rise
of 1 ◦ C per decade!
DYNAMICAL OCEANOGRAPHY
-1 10
5
-8 10
4
-6 10
4
-4 10
4
-2 10
4
0
-45
-40
-35
-30
Time (yr)
δ δ
δ
δ
18 O
cold
warm
Transition
from Eemian
Last Glacial
Maximum
Holocene
Figure 16.2. Oxygen isotope record of the last interglacial and the most recent glacial episode.
A change in δ
18 O of one unit corresponds to about a temperature change of about 2
◦ C.
10 ◦ C. Spectral analysis reveals that the periodicities of the cold/warm fluctuations are about 40,000 and 20,000 years. The signatures of these changes are also
visible globally, but the spatial extent of the signal reveals that these fluctuations
are somehow forced in the northern hemisphere.
When the transition from the Last Glacial Maximum to the Holocene is considered in more detail, rapid transitions are observed. Sudden warm periods (interstadials), which last for 500 - 2,000 years, appear with temperature changes of
about 5 ◦ C. These transitions between cold and warm episodes are also confirmed
in δ 18 O records from ocean sediments and are called Dansgaard-Oeschger events
(cf. section 2.4). A magnification of the δ 18 O record from the GRIP ice core is
plotted in Fig. 16.3. Of particular interest is that the warming of the earth from
20,000 years ago onward has been in several relatively distinct stages. First, relatively fast transitions to the Bølling and Allerød interstadials occur, where the
temperatures are relatively high. This is followed by a period of significant cooling between 12,500 and 11,500 years ago. The resulting stadial is referred to as
the Younger Dryas, during which the apparent warming trend was delayed for
approximately 1,000 years. The period ends with a rapid shift to warmer temperatures into the beginning of the Holocene, with indications of a temperature rise
of 1 ◦ C per decade!