

Arctic Ocean Circulation
369
from the NCEP/NCAR reanalysis project and averaged over the years 1950-2000
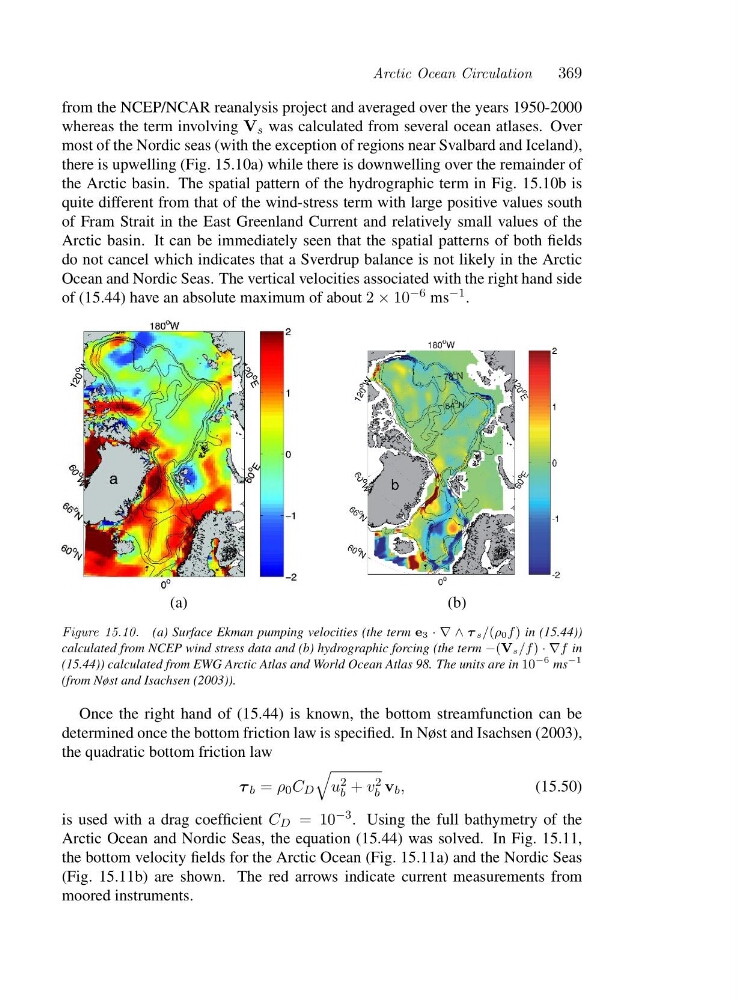
whereas the term involving V s was calculated from several ocean atlases. Over
most of the Nordic seas (with the exception of regions near Svalbard and Iceland),
there is upwelling (Fig. 15.10a) while there is downwelling over the remainder of
the Arctic basin. The spatial pattern of the hydrographic term in Fig. 15.10b is
quite different from that of the wind-stress term with large positive values south
of Fram Strait in the East Greenland Current and relatively small values of the
Arctic basin. It can be immediately seen that the spatial patterns of both fields
do not cancel which indicates that a Sverdrup balance is not likely in the Arctic
Ocean and Nordic Seas. The vertical velocities associated with the right hand side
of (15.44) have an absolute maximum of about 2 × 10 −6 ms −1 .
(a)
(b)
Figure 15.10. (a) Surface Ekman pumping velocities (the term e3 ·∇∧τ s/(ρ0f ) in (15.44))
calculated from NCEP wind stress data and (b) hydrographic forcing (the term −(Vs/f ) ·∇f in
(15.44)) calculated from EWG Arctic Atlas and World Ocean Atlas 98. The units are in 10
−6 ms
−1
(from Nøst and Isachsen (2003)).
Once the right hand of (15.44) is known, the bottom streamfunction can be
determined once the bottom friction law is specified. In Nøst and Isachsen (2003),
the quadratic bottom friction law
τ b = ρ 0 C D
u 2
b + v 2
b v b ,
(15.50)
is used with a drag coefficient C D =1 0 −3 . Using the full bathymetry of the
Arctic Ocean and Nordic Seas, the equation (15.44) was solved. In Fig. 15.11,
the bottom velocity fields for the Arctic Ocean (Fig. 15.11a) and the Nordic Seas
(Fig. 15.11b) are shown. The red arrows indicate current measurements from
moored instruments.
369
from the NCEP/NCAR reanalysis project and averaged over the years 1950-2000
whereas the term involving V s was calculated from several ocean atlases. Over
most of the Nordic seas (with the exception of regions near Svalbard and Iceland),
there is upwelling (Fig. 15.10a) while there is downwelling over the remainder of
the Arctic basin. The spatial pattern of the hydrographic term in Fig. 15.10b is
quite different from that of the wind-stress term with large positive values south
of Fram Strait in the East Greenland Current and relatively small values of the
Arctic basin. It can be immediately seen that the spatial patterns of both fields
do not cancel which indicates that a Sverdrup balance is not likely in the Arctic
Ocean and Nordic Seas. The vertical velocities associated with the right hand side
of (15.44) have an absolute maximum of about 2 × 10 −6 ms −1 .
(a)
(b)
Figure 15.10. (a) Surface Ekman pumping velocities (the term e3 ·∇∧τ s/(ρ0f ) in (15.44))
calculated from NCEP wind stress data and (b) hydrographic forcing (the term −(Vs/f ) ·∇f in
(15.44)) calculated from EWG Arctic Atlas and World Ocean Atlas 98. The units are in 10
−6 ms
−1
(from Nøst and Isachsen (2003)).
Once the right hand of (15.44) is known, the bottom streamfunction can be
determined once the bottom friction law is specified. In Nøst and Isachsen (2003),
the quadratic bottom friction law
τ b = ρ 0 C D
u 2
b + v 2
b v b ,
(15.50)
is used with a drag coefficient C D =1 0 −3 . Using the full bathymetry of the
Arctic Ocean and Nordic Seas, the equation (15.44) was solved. In Fig. 15.11,
the bottom velocity fields for the Arctic Ocean (Fig. 15.11a) and the Nordic Seas
(Fig. 15.11b) are shown. The red arrows indicate current measurements from
moored instruments.