

370
DYNAMICAL OCEANOGRAPHY
1 2 0 o
W
60
o
W
0
o
6 0 o
E
12
0
o
E
180 o
W
6 8
o N
72 o
N
76 o
N
80 o
N
84 o
N
88 o
N
1 0 c m /s
(a)
18 o
W
9 o
W
0
o
9
o E
18
o E
64 o
N
68 o
N
72 o
N
76 o
N
80 o
N
0.1 m/s
(b)
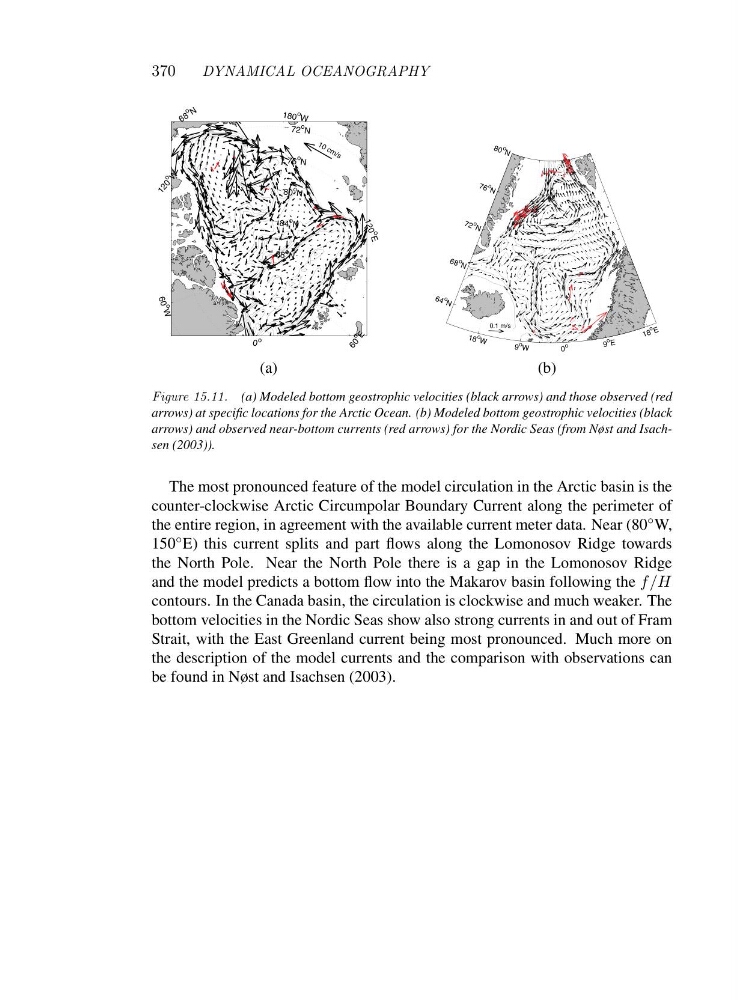
Figure 15.11. (a) Modeled bottom geostrophic velocities (black arrows) and those observed (red
arrows) at specific locations for the Arctic Ocean. (b) Modeled bottom geostrophic velocities (black
arrows) and observed near-bottom currents (red arrows) for the Nordic Seas (from Nøst and Isachsen (2003)).
The most pronounced feature of the model circulation in the Arctic basin is the
counter-clockwise Arctic Circumpolar Boundary Current along the perimeter of
the entire region, in agreement with the available current meter data. Near (80 ◦ W,
150 ◦ E) this current splits and part flows along the Lomonosov Ridge towards
the North Pole. Near the North Pole there is a gap in the Lomonosov Ridge
and the model predicts a bottom flow into the Makarov basin following the f/H
contours. In the Canada basin, the circulation is clockwise and much weaker. The
bottom velocities in the Nordic Seas show also strong currents in and out of Fram
Strait, with the East Greenland current being most pronounced. Much more on
the description of the model currents and the comparison with observations can
be found in Nøst and Isachsen (2003).
DYNAMICAL OCEANOGRAPHY
1 2 0 o
W
60
o
W
0
o
6 0 o
E
12
0
o
E
180 o
W
6 8
o N
72 o
N
76 o
N
80 o
N
84 o
N
88 o
N
1 0 c m /s
(a)
18 o
W
9 o
W
0
o
9
o E
18
o E
64 o
N
68 o
N
72 o
N
76 o
N
80 o
N
0.1 m/s
(b)
Figure 15.11. (a) Modeled bottom geostrophic velocities (black arrows) and those observed (red
arrows) at specific locations for the Arctic Ocean. (b) Modeled bottom geostrophic velocities (black
arrows) and observed near-bottom currents (red arrows) for the Nordic Seas (from Nøst and Isachsen (2003)).
The most pronounced feature of the model circulation in the Arctic basin is the
counter-clockwise Arctic Circumpolar Boundary Current along the perimeter of
the entire region, in agreement with the available current meter data. Near (80 ◦ W,
150 ◦ E) this current splits and part flows along the Lomonosov Ridge towards
the North Pole. Near the North Pole there is a gap in the Lomonosov Ridge
and the model predicts a bottom flow into the Makarov basin following the f/H
contours. In the Canada basin, the circulation is clockwise and much weaker. The
bottom velocities in the Nordic Seas show also strong currents in and out of Fram
Strait, with the East Greenland current being most pronounced. Much more on
the description of the model currents and the comparison with observations can
be found in Nøst and Isachsen (2003).