

Afi r s ti m p r e s s i o n
17
density σ t
24
24 .5
25
25
25 .5
25 .5
25 .5
26
26
26
2 6
2 6 .5
26 .5
26 .5
26 .5
2 7
2 7
27
27
2 7 .5
2 7 .5
27 .5
2 8
2 8
28
2 8 .5
2 8 .5
2 9
Salinity
Temperature
33.5
34
34.5
35
35.5
36
36.5
−2
0
2
4
6
8
10
12
14
16
18
20
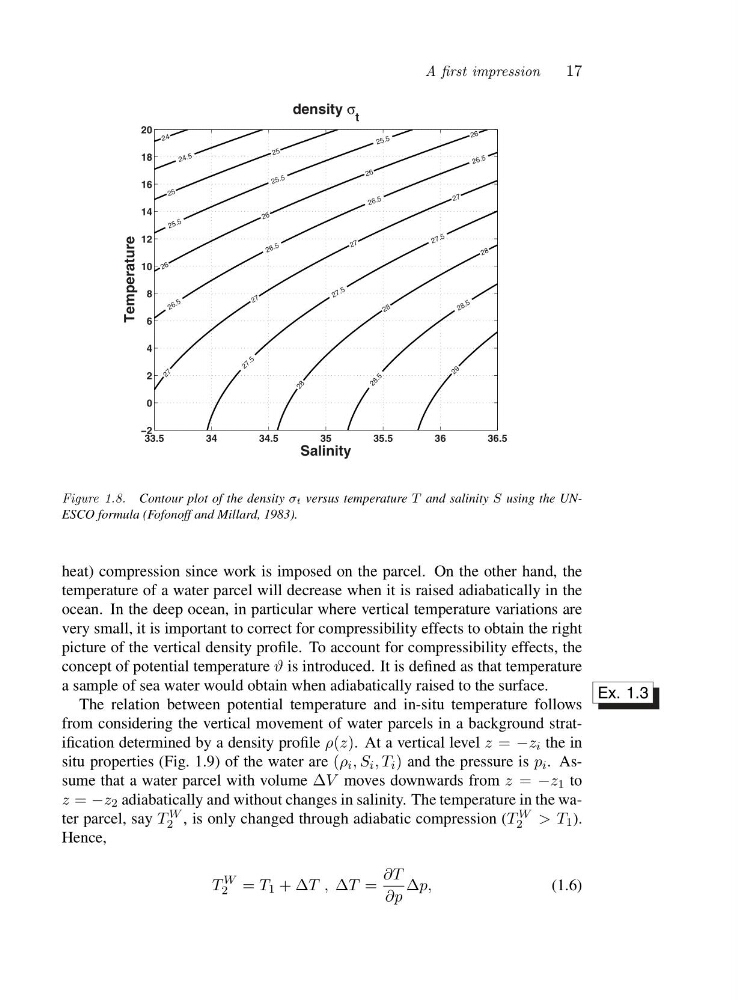
Figure 1.8. Contour plot of the density σt versus temperature T and salinity S using the UNESCO formula (Fofonoff and Millard, 1983).
heat) compression since work is imposed on the parcel. On the other hand, the
temperature of a water parcel will decrease when it is raised adiabatically in the
ocean. In the deep ocean, in particular where vertical temperature variations are
very small, it is important to correct for compressibility effects to obtain the right
picture of the vertical density profile. To account for compressibility effects, the
concept of potential temperature ϑ is introduced. It is defined as that temperature
a sample of sea water would obtain when adiabatically raised to the surface.
The relation between potential temperature and in-situ temperature follows
Ex. 1.3
from considering the vertical movement of water parcels in a background stratification determined by a density profile ρ(z). At a vertical level z = −z i the in
situ properties (Fig. 1.9) of the water are (ρ i ,S i ,T i ) and the pressure is p i .A s -
sume that a water parcel with volume ΔV moves downwards from z = −z 1 to
z = −z 2 adiabatically and without changes in salinity. The temperature in the water parcel, say T W
2 , is only changed through adiabatic compression (T W
2 >T 1 ).
Hence,
T
W
2 = T 1 +ΔT,ΔT =
∂T
∂p
Δp,
(1.6)
17
density σ t
24
24 .5
25
25
25 .5
25 .5
25 .5
26
26
26
2 6
2 6 .5
26 .5
26 .5
26 .5
2 7
2 7
27
27
2 7 .5
2 7 .5
27 .5
2 8
2 8
28
2 8 .5
2 8 .5
2 9
Salinity
Temperature
33.5
34
34.5
35
35.5
36
36.5
−2
0
2
4
6
8
10
12
14
16
18
20
Figure 1.8. Contour plot of the density σt versus temperature T and salinity S using the UNESCO formula (Fofonoff and Millard, 1983).
heat) compression since work is imposed on the parcel. On the other hand, the
temperature of a water parcel will decrease when it is raised adiabatically in the
ocean. In the deep ocean, in particular where vertical temperature variations are
very small, it is important to correct for compressibility effects to obtain the right
picture of the vertical density profile. To account for compressibility effects, the
concept of potential temperature ϑ is introduced. It is defined as that temperature
a sample of sea water would obtain when adiabatically raised to the surface.
The relation between potential temperature and in-situ temperature follows
Ex. 1.3
from considering the vertical movement of water parcels in a background stratification determined by a density profile ρ(z). At a vertical level z = −z i the in
situ properties (Fig. 1.9) of the water are (ρ i ,S i ,T i ) and the pressure is p i .A s -
sume that a water parcel with volume ΔV moves downwards from z = −z 1 to
z = −z 2 adiabatically and without changes in salinity. The temperature in the water parcel, say T W
2 , is only changed through adiabatic compression (T W
2 >T 1 ).
Hence,
T
W
2 = T 1 +ΔT,ΔT =
∂T
∂p
Δp,
(1.6)