

16
DYNAMICAL OCEANOGRAPHY
Water Mass
T ( ◦ C)
S (ppt)
North Atlantic Deep Water (NADW)
2-4
34.9-35.0
Antarctic Bottom Water (AABW)
-0.5 - 0 34.6 - 34.7
Antarctic Intermediate Water (AAIW)
3-4
34.2 - 34.3
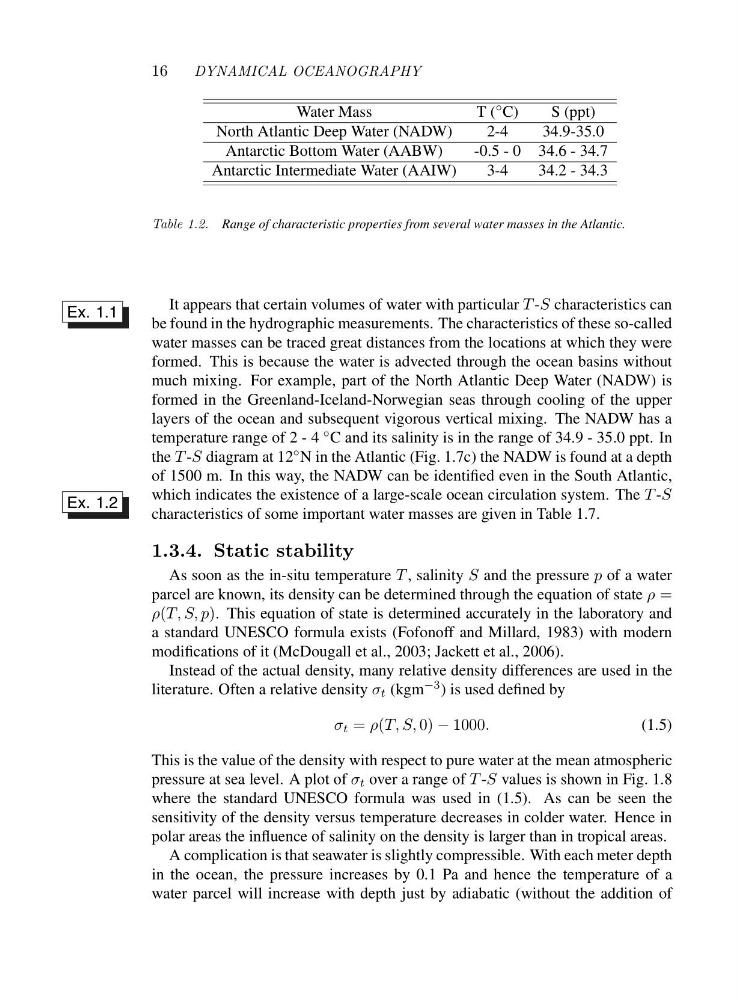
Table 1.2. Range of characteristic properties from several water masses in the Atlantic.
It appears that certain volumes of water with particular T -S characteristics can
be found in the hydrographic measurements. The characteristics of these so-called
Ex. 1.1
water masses can be traced great distances from the locations at which they were
formed. This is because the water is advected through the ocean basins without
much mixing. For example, part of the North Atlantic Deep Water (NADW) is
formed in the Greenland-Iceland-Norwegian seas through cooling of the upper
layers of the ocean and subsequent vigorous vertical mixing. The NADW has a
temperature range of 2 - 4 ◦ C and its salinity is in the range of 34.9 - 35.0 ppt. In
the T -S diagram at 12 ◦ N in the Atlantic (Fig. 1.7c) the NADW is found at a depth
of 1500 m. In this way, the NADW can be identified even in the South Atlantic,
which indicates the existence of a large-scale ocean circulation system. The T -S
characteristics of some important water masses are given in Table 1.7.
Ex. 1.2
1.3.4. Static stability
As soon as the in-situ temperature T , salinity S and the pressure p of a water
parcel are known, its density can be determined through the equation of state ρ =
ρ(T,S,p). This equation of state is determined accurately in the laboratory and
a standard UNESCO formula exists (Fofonoff and Millard, 1983) with modern
modifications of it (McDougall et al., 2003; Jackett et al., 2006).
Instead of the actual density, many relative density differences are used in the
literature. Often a relative density σ t (kgm −3 )isuseddefinedby
σ t = ρ(T,S,0) − 1000.
(1.5)
This is the value of the density with respect to pure water at the mean atmospheric
pressure at sea level. A plot of σ t over a range of T -S values is shown in Fig. 1.8
where the standard UNESCO formula was used in (1.5). As can be seen the
sensitivity of the density versus temperature decreases in colder water. Hence in
polar areas the influence of salinity on the density is larger than in tropical areas.
A complication is that seawater is slightly compressible. With each meter depth
in the ocean, the pressure increases by 0.1 Pa and hence the temperature of a
water parcel will increase with depth just by adiabatic (without the addition of
DYNAMICAL OCEANOGRAPHY
Water Mass
T ( ◦ C)
S (ppt)
North Atlantic Deep Water (NADW)
2-4
34.9-35.0
Antarctic Bottom Water (AABW)
-0.5 - 0 34.6 - 34.7
Antarctic Intermediate Water (AAIW)
3-4
34.2 - 34.3
Table 1.2. Range of characteristic properties from several water masses in the Atlantic.
It appears that certain volumes of water with particular T -S characteristics can
be found in the hydrographic measurements. The characteristics of these so-called
Ex. 1.1
water masses can be traced great distances from the locations at which they were
formed. This is because the water is advected through the ocean basins without
much mixing. For example, part of the North Atlantic Deep Water (NADW) is
formed in the Greenland-Iceland-Norwegian seas through cooling of the upper
layers of the ocean and subsequent vigorous vertical mixing. The NADW has a
temperature range of 2 - 4 ◦ C and its salinity is in the range of 34.9 - 35.0 ppt. In
the T -S diagram at 12 ◦ N in the Atlantic (Fig. 1.7c) the NADW is found at a depth
of 1500 m. In this way, the NADW can be identified even in the South Atlantic,
which indicates the existence of a large-scale ocean circulation system. The T -S
characteristics of some important water masses are given in Table 1.7.
Ex. 1.2
1.3.4. Static stability
As soon as the in-situ temperature T , salinity S and the pressure p of a water
parcel are known, its density can be determined through the equation of state ρ =
ρ(T,S,p). This equation of state is determined accurately in the laboratory and
a standard UNESCO formula exists (Fofonoff and Millard, 1983) with modern
modifications of it (McDougall et al., 2003; Jackett et al., 2006).
Instead of the actual density, many relative density differences are used in the
literature. Often a relative density σ t (kgm −3 )isuseddefinedby
σ t = ρ(T,S,0) − 1000.
(1.5)
This is the value of the density with respect to pure water at the mean atmospheric
pressure at sea level. A plot of σ t over a range of T -S values is shown in Fig. 1.8
where the standard UNESCO formula was used in (1.5). As can be seen the
sensitivity of the density versus temperature decreases in colder water. Hence in
polar areas the influence of salinity on the density is larger than in tropical areas.
A complication is that seawater is slightly compressible. With each meter depth
in the ocean, the pressure increases by 0.1 Pa and hence the temperature of a
water parcel will increase with depth just by adiabatic (without the addition of