

Dynamics of ENSO
275
plotted. It appears that the occurrence of El Ni˜ no’s (positive NINO3) and La
Ni˜ na’s (negative NINO3) is quite irregular. Strong El Ni˜ no’s such as in 19821983 and 1997-1998 are rare as are strong La Ni˜ na’s and actually long intervals
exist with either weak warm or weak cold conditions. An index that captures the
amplitude of the sea level pressure anomaly pattern is the Southern Oscillation Index (SOI), which is the normalized difference of the pressure anomalies between
Tahiti (18 ◦ S, 150 ◦ W) and Darwin (12 ◦ S, 131 ◦ E). When this index is positive,
the trade winds are stronger and when it is negative the trade winds are weaker
than normal. Generally, periods with a high NINO3 index have a low SOI and
vice versa (Fig. 12.1). The correlation between 12-month means of the monthly
NINO3 index and the SOI is close to -0.9 over the last 50 years.
An accurate data set of Tropical Pacific SST fields is now available for long
enough, such that dominant patterns of variability at interannual time scales can be
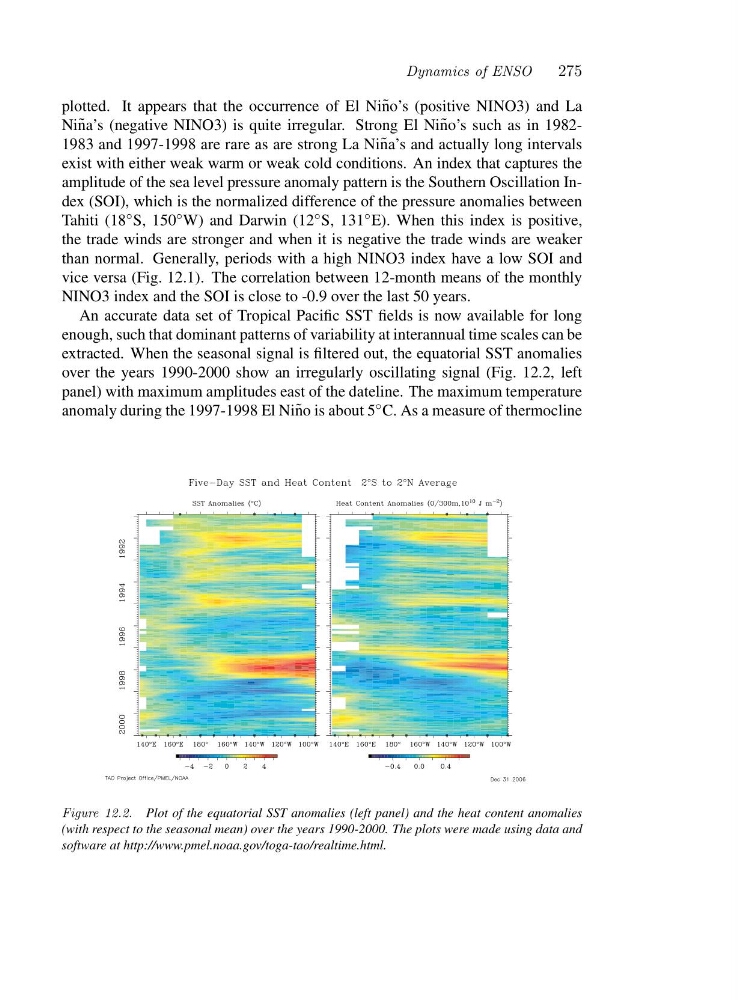
extracted. When the seasonal signal is filtered out, the equatorial SST anomalies
over the years 1990-2000 show an irregularly oscillating signal (Fig. 12.2, left
panel) with maximum amplitudes east of the dateline. The maximum temperature
anomaly during the 1997-1998 El Ni˜ no is about 5 ◦ C. As a measure of thermocline
Figure 12.2. Plot of the equatorial SST anomalies (left panel) and the heat content anomalies
(with respect to the seasonal mean) over the years 1990-2000. The plots were made using data and
software at http://www.pmel.noaa.gov/toga-tao/realtime.html.
275
plotted. It appears that the occurrence of El Ni˜ no’s (positive NINO3) and La
Ni˜ na’s (negative NINO3) is quite irregular. Strong El Ni˜ no’s such as in 19821983 and 1997-1998 are rare as are strong La Ni˜ na’s and actually long intervals
exist with either weak warm or weak cold conditions. An index that captures the
amplitude of the sea level pressure anomaly pattern is the Southern Oscillation Index (SOI), which is the normalized difference of the pressure anomalies between
Tahiti (18 ◦ S, 150 ◦ W) and Darwin (12 ◦ S, 131 ◦ E). When this index is positive,
the trade winds are stronger and when it is negative the trade winds are weaker
than normal. Generally, periods with a high NINO3 index have a low SOI and
vice versa (Fig. 12.1). The correlation between 12-month means of the monthly
NINO3 index and the SOI is close to -0.9 over the last 50 years.
An accurate data set of Tropical Pacific SST fields is now available for long
enough, such that dominant patterns of variability at interannual time scales can be
extracted. When the seasonal signal is filtered out, the equatorial SST anomalies
over the years 1990-2000 show an irregularly oscillating signal (Fig. 12.2, left
panel) with maximum amplitudes east of the dateline. The maximum temperature
anomaly during the 1997-1998 El Ni˜ no is about 5 ◦ C. As a measure of thermocline
Figure 12.2. Plot of the equatorial SST anomalies (left panel) and the heat content anomalies
(with respect to the seasonal mean) over the years 1990-2000. The plots were made using data and
software at http://www.pmel.noaa.gov/toga-tao/realtime.html.