

14
DYNAMICAL OCEANOGRAPHY
measurement is important because of the large effect on the density distribution
in the water column.
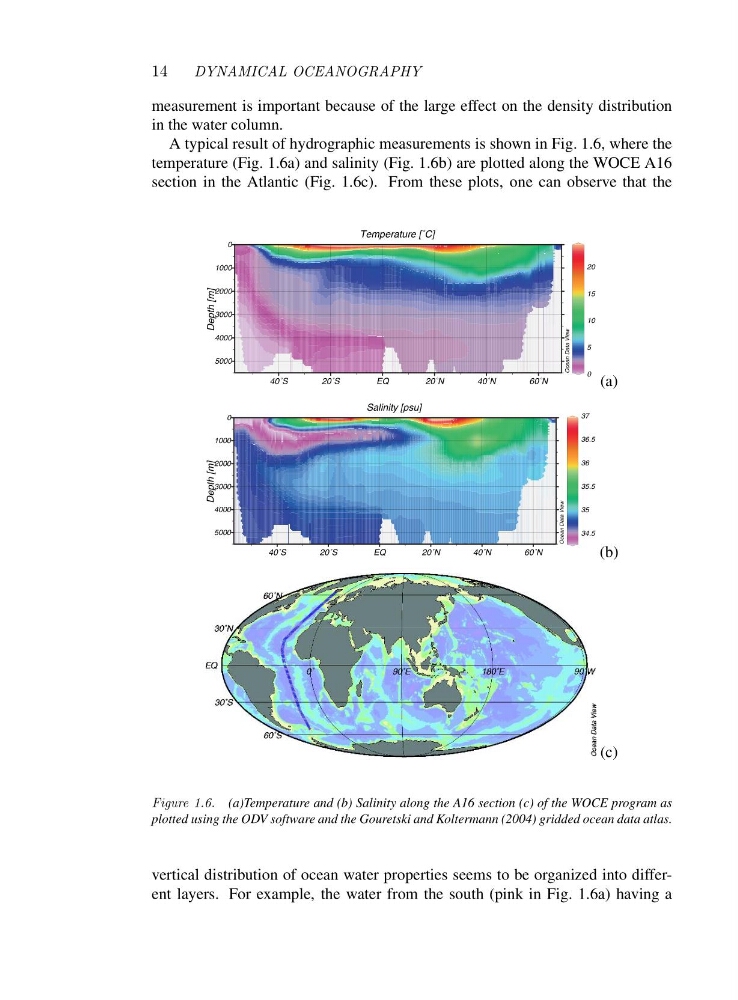
A typical result of hydrographic measurements is shown in Fig. 1.6, where the
temperature (Fig. 1.6a) and salinity (Fig. 1.6b) are plotted along the WOCE A16
section in the Atlantic (Fig. 1.6c). From these plots, one can observe that the
0
5
10
15
20
Ocean Data View
40˚S
20˚S
EQ
20˚N
40˚N
60˚N
5000
4000
3000
2000
1000
0
Temperature [˚C]
Depth [m]
(a)
34.5
35
35.5
36
36.5
37
Ocean Data View
40˚S
20˚S
EQ
20˚N
40˚N
60˚N
5000
4000
3000
2000
1000
0
Salinity [psu]
Depth [m]
(b)
(c)
Figure 1.6. (a)Temperature and (b) Salinity along the A16 section (c) of the WOCE program as
plotted using the ODV software and the Gouretski and Koltermann (2004) gridded ocean data atlas.
vertical distribution of ocean water properties seems to be organized into different layers. For example, the water from the south (pink in Fig. 1.6a) having a
DYNAMICAL OCEANOGRAPHY
measurement is important because of the large effect on the density distribution
in the water column.
A typical result of hydrographic measurements is shown in Fig. 1.6, where the
temperature (Fig. 1.6a) and salinity (Fig. 1.6b) are plotted along the WOCE A16
section in the Atlantic (Fig. 1.6c). From these plots, one can observe that the
0
5
10
15
20
Ocean Data View
40˚S
20˚S
EQ
20˚N
40˚N
60˚N
5000
4000
3000
2000
1000
0
Temperature [˚C]
Depth [m]
(a)
34.5
35
35.5
36
36.5
37
Ocean Data View
40˚S
20˚S
EQ
20˚N
40˚N
60˚N
5000
4000
3000
2000
1000
0
Salinity [psu]
Depth [m]
(b)
(c)
Figure 1.6. (a)Temperature and (b) Salinity along the A16 section (c) of the WOCE program as
plotted using the ODV software and the Gouretski and Koltermann (2004) gridded ocean data atlas.
vertical distribution of ocean water properties seems to be organized into different layers. For example, the water from the south (pink in Fig. 1.6a) having a