

period from October 12, 2014 through June 1, to perform simulations with the
thermodynamic 1D model (see section “Model Description” for details). The choice
of October 12 as the start date for ice formation in the model agrees well with ice
observations carried out daily in October–November in the Gulf of Tiksi. The
extended period of negative air temperatures, which dropped below −40 °C in
January and February 2015, results in substantial ice production in the Gulf, so that
at the end of ice growth season in the Laptev Sea (late May), fast ice thickness
reaches 2.08 m.
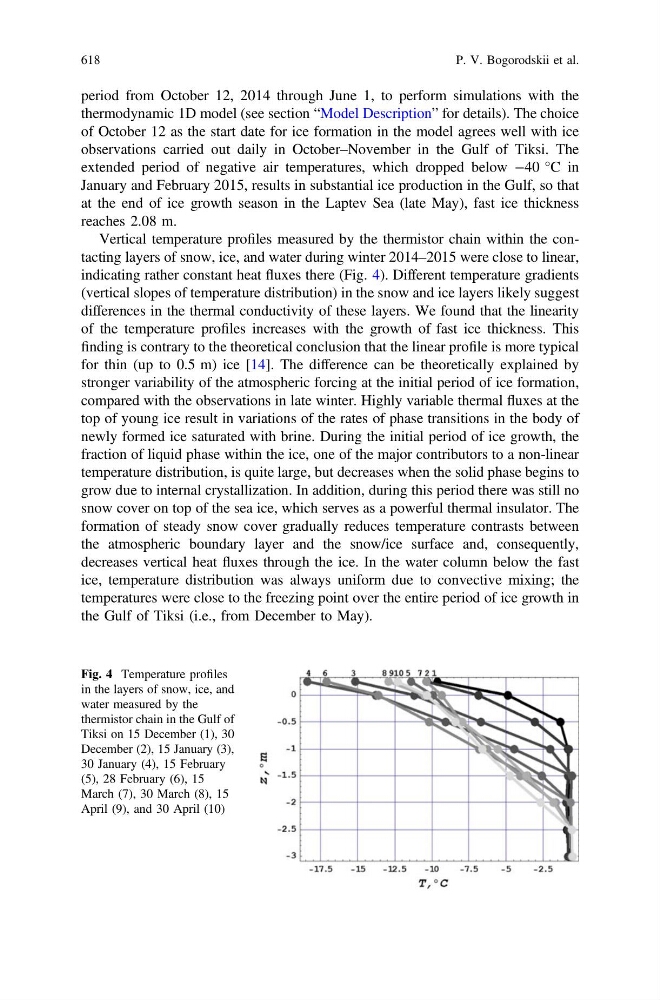
Vertical temperature profiles measured by the thermistor chain within the contacting layers of snow, ice, and water during winter 2014–2015 were close to linear,
indicating rather constant heat fluxes there (Fig. 4). Different temperature gradients
(vertical slopes of temperature distribution) in the snow and ice layers likely suggest
differences in the thermal conductivity of these layers. We found that the linearity
of the temperature profiles increases with the growth of fast ice thickness. This
finding is contrary to the theoretical conclusion that the linear profile is more typical
for thin (up to 0.5 m) ice [14]. The difference can be theoretically explained by
stronger variability of the atmospheric forcing at the initial period of ice formation,
compared with the observations in late winter. Highly variable thermal fluxes at the
top of young ice result in variations of the rates of phase transitions in the body of
newly formed ice saturated with brine. During the initial period of ice growth, the
fraction of liquid phase within the ice, one of the major contributors to a non-linear
temperature distribution, is quite large, but decreases when the solid phase begins to
grow due to internal crystallization. In addition, during this period there was still no
snow cover on top of the sea ice, which serves as a powerful thermal insulator. The
formation of steady snow cover gradually reduces temperature contrasts between
the atmospheric boundary layer and the snow/ice surface and, consequently,
decreases vertical heat fluxes through the ice. In the water column below the fast
ice, temperature distribution was always uniform due to convective mixing; the
temperatures were close to the freezing point over the entire period of ice growth in
the Gulf of Tiksi (i.e., from December to May).
Fig. 4 Temperature profiles
in the layers of snow, ice, and
water measured by the
thermistor chain in the Gulf of
Tiksi on 15 December (1), 30
December (2), 15 January (3),
30 January (4), 15 February
(5), 28 February (6), 15
March (7), 30 March (8), 15
April (9), and 30 April (10)
618
P. V. Bogorodskii et al.