

Simulation Results
We performed simulations of the seasonal growth of fast ice and freezing of bottom
sediments using the model described in section “Model Description”. To do so,
model (1)–(8) was integrated over 230 days, from October 12, 2014 through June 1,
2015, for the initial water salinity of 10 psu and 1-, 1.5-, and 3-m bottom depths.
The geothermal heat fluxes at the interface between the mushy zone and the
underlying, completely melted layer of bottom sediment were taken as
Q th = 0.06 Wt ̸ m
2 . The date of the onset of ice formation was determined from
regular ice observations carried out at the Tiksi station. Three-hour measurements
of air temperature, relative humidity, wind velocity, atmospheric pressure, total
cloudiness, and snow thickness over the ice surface averaged over daily intervals
were utilized as an atmospheric forcing for the model.
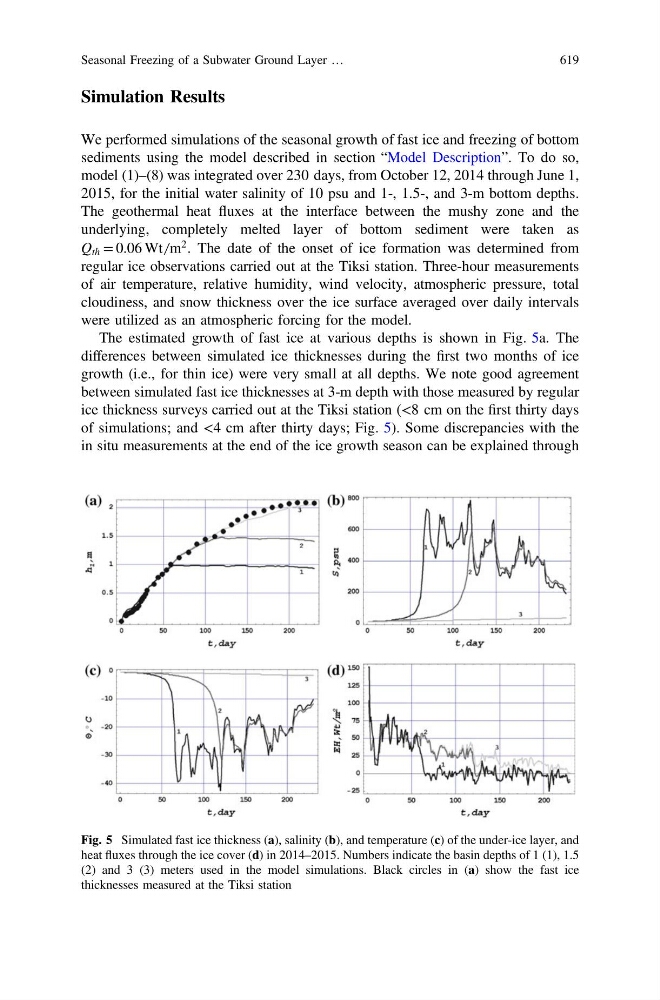
The estimated growth of fast ice at various depths is shown in Fig. 5a. The
differences between simulated ice thicknesses during the first two months of ice
growth (i.e., for thin ice) were very small at all depths. We note good agreement
between simulated fast ice thicknesses at 3-m depth with those measured by regular
ice thickness surveys carried out at the Tiksi station (<8 cm on the first thirty days
of simulations; and <4 cm after thirty days; Fig. 5). Some discrepancies with the
in situ measurements at the end of the ice growth season can be explained through
Fig. 5 Simulated fast ice thickness (a), salinity (b), and temperature (c) of the under-ice layer, and
heat fluxes through the ice cover (d) in 2014–2015. Numbers indicate the basin depths of 1 (1), 1.5
(2) and 3 (3) meters used in the model simulations. Black circles in (a) show the fast ice
thicknesses measured at the Tiksi station
Seasonal Freezing of a Subwater Ground Layer …
619