

ν eq = 2 θ ν 2 ̸ Θ + θ
ð
Þ,
ð8Þ
In this case, the lower boundary moisture ν 2 is a free model parameter, prescribed a priori.
We summarize major model parameters used in the simulations in Table 1. The
water content of the frozen and thawed zones interface was set to 0.1.
Ice Temperature Observations
In this section, we describe 2014–2015 ice/water temperature observations collected by the deployed thermistor chain (Fig. 2 for location), to provide insight into
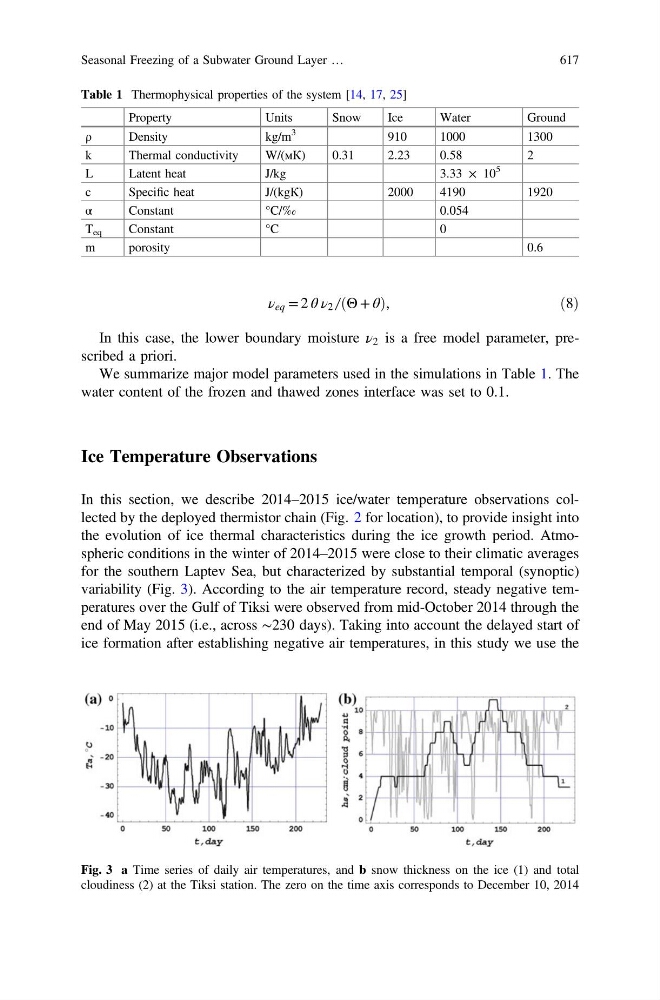
the evolution of ice thermal characteristics during the ice growth period. Atmospheric conditions in the winter of 2014–2015 were close to their climatic averages
for the southern Laptev Sea, but characterized by substantial temporal (synoptic)
variability (Fig. 3). According to the air temperature record, steady negative temperatures over the Gulf of Tiksi were observed from mid-October 2014 through the
end of May 2015 (i.e., across ∼230 days). Taking into account the delayed start of
ice formation after establishing negative air temperatures, in this study we use the
Table 1 Thermophysical properties of the system [14, 17, 25]
Property
Units
Snow
Ice
Water
Ground
ρ
Density
kg/m
3
910
1000
1300
k
Thermal conductivity
W/(мК)
0.31
2.23
0.58
2
L
Latent heat
J/kg
3.33 × 10
5
c
Specific heat
J/(kgК)
2000
4190
1920
α
Constant
°C/‰
0.054
T eq
Constant
°C
0
m
porosity
0.6
Fig. 3 a Time series of daily air temperatures, and b snow thickness on the ice (1) and total
cloudiness (2) at the Tiksi station. The zero on the time axis corresponds to December 10, 2014
Seasonal Freezing of a Subwater Ground Layer …
617