

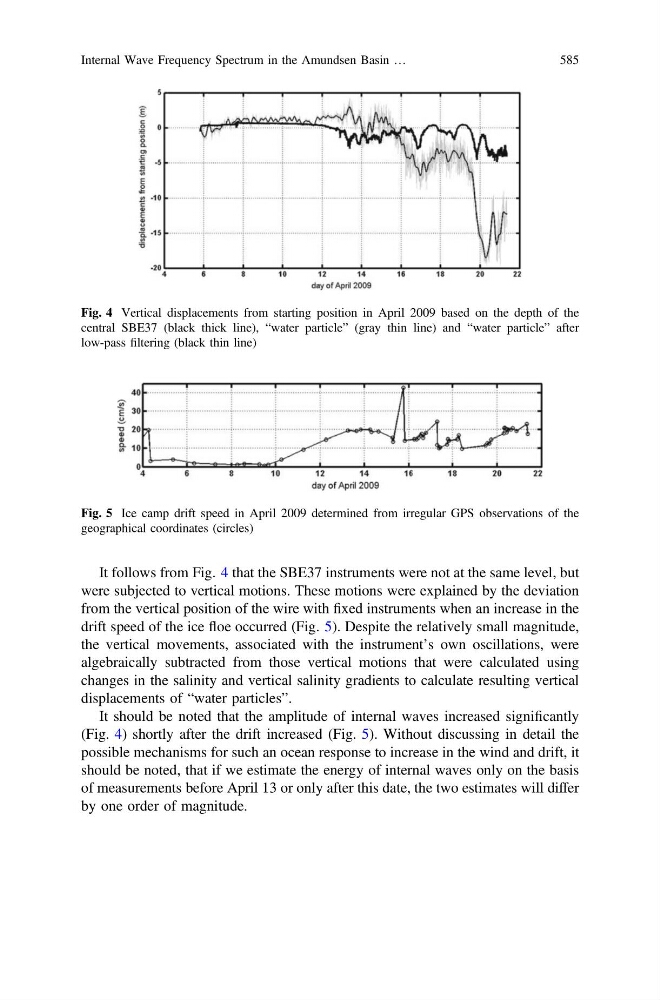
It follows from Fig. 4 that the SBE37 instruments were not at the same level, but
were subjected to vertical motions. These motions were explained by the deviation
from the vertical position of the wire with fixed instruments when an increase in the
drift speed of the ice floe occurred (Fig. 5). Despite the relatively small magnitude,
the vertical movements, associated with the instrument’s own oscillations, were
algebraically subtracted from those vertical motions that were calculated using
changes in the salinity and vertical salinity gradients to calculate resulting vertical
displacements of “water particles”.
It should be noted that the amplitude of internal waves increased significantly
(Fig. 4) shortly after the drift increased (Fig. 5). Without discussing in detail the
possible mechanisms for such an ocean response to increase in the wind and drift, it
should be noted, that if we estimate the energy of internal waves only on the basis
of measurements before April 13 or only after this date, the two estimates will differ
by one order of magnitude.
Fig. 4 Vertical displacements from starting position in April 2009 based on the depth of the
central SBE37 (black thick line), “water particle” (gray thin line) and “water particle” after
low-pass filtering (black thin line)
Fig. 5 Ice camp drift speed in April 2009 determined from irregular GPS observations of the
geographical coordinates (circles)
Internal Wave Frequency Spectrum in the Amundsen Basin …
585