

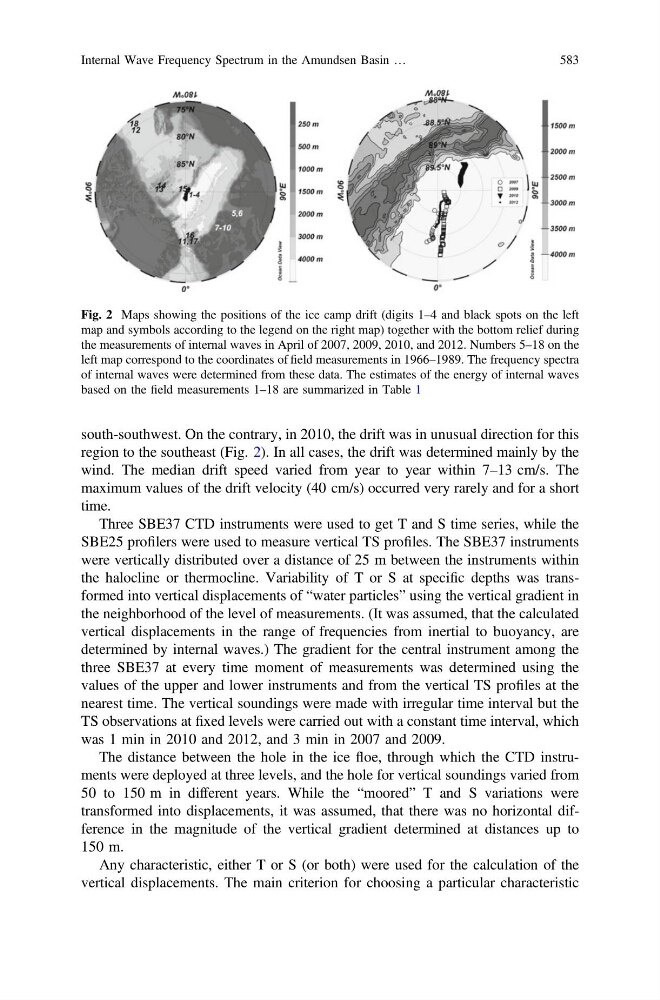
south-southwest. On the contrary, in 2010, the drift was in unusual direction for this
region to the southeast (Fig. 2). In all cases, the drift was determined mainly by the
wind. The median drift speed varied from year to year within 7–13 cm/s. The
maximum values of the drift velocity (40 cm/s) occurred very rarely and for a short
time.
Three SBE37 CTD instruments were used to get T and S time series, while the
SBE25 profilers were used to measure vertical TS profiles. The SBE37 instruments
were vertically distributed over a distance of 25 m between the instruments within
the halocline or thermocline. Variability of T or S at specific depths was transformed into vertical displacements of “water particles” using the vertical gradient in
the neighborhood of the level of measurements. (It was assumed, that the calculated
vertical displacements in the range of frequencies from inertial to buoyancy, are
determined by internal waves.) The gradient for the central instrument among the
three SBE37 at every time moment of measurements was determined using the
values of the upper and lower instruments and from the vertical TS profiles at the
nearest time. The vertical soundings were made with irregular time interval but the
TS observations at fixed levels were carried out with a constant time interval, which
was 1 min in 2010 and 2012, and 3 min in 2007 and 2009.
The distance between the hole in the ice floe, through which the CTD instruments were deployed at three levels, and the hole for vertical soundings varied from
50 to 150 m in different years. While the “moored” T and S variations were
transformed into displacements, it was assumed, that there was no horizontal difference in the magnitude of the vertical gradient determined at distances up to
150 m.
Any characteristic, either T or S (or both) were used for the calculation of the
vertical displacements. The main criterion for choosing a particular characteristic
Fig. 2 Maps showing the positions of the ice camp drift (digits 1–4 and black spots on the left
map and symbols according to the legend on the right map) together with the bottom relief during
the measurements of internal waves in April of 2007, 2009, 2010, and 2012. Numbers 5–18 on the
left map correspond to the coordinates of field measurements in 1966–1989. The frequency spectra
of internal waves were determined from these data. The estimates of the energy of internal waves
based on the field measurements 1–18 are summarized in Table 1
Internal Wave Frequency Spectrum in the Amundsen Basin …
583