

The major sources of data needed for model forcing and assimilation are shown
in Fig. 5 and include velocity observations from three mooring arrays; multiple
CTD surveys. In addition, we assimilate the gridded SSH anomalies from the
AVISO data set referenced to the regional MDOT and background information
from the reconstructed seasonal climatologies of the Bering Sea (Section “The
Regional 4dVar Data Assimilation System”).
The optimized evolution of the EBS state was obtained by assimilating the above
described data over 49 4-week time windows spanning the period of January 1,
2007 to October 3, 2010. On the average, 300 × 4 = 1200 iterations were required
to achieve the nested 4dVar convergence of a single 4-week problem.
Mass, heat and freshwater transports. The 4dVar-optimized weekly averaged
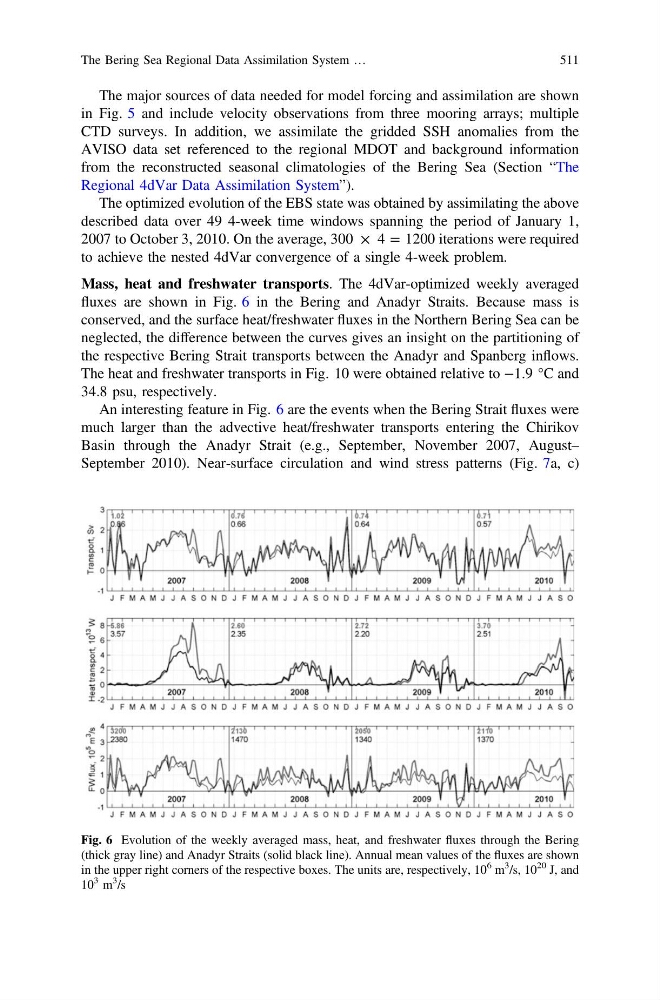
fluxes are shown in Fig. 6 in the Bering and Anadyr Straits. Because mass is
conserved, and the surface heat/freshwater fluxes in the Northern Bering Sea can be
neglected, the difference between the curves gives an insight on the partitioning of
the respective Bering Strait transports between the Anadyr and Spanberg inflows.
The heat and freshwater transports in Fig. 10 were obtained relative to −1.9 °C and
34.8 psu, respectively.
An interesting feature in Fig. 6 are the events when the Bering Strait fluxes were
much larger than the advective heat/freshwater transports entering the Chirikov
Basin through the Anadyr Strait (e.g., September, November 2007, August–
September 2010). Near-surface circulation and wind stress patterns (Fig. 7a, c)
Fig. 6 Evolution of the weekly averaged mass, heat, and freshwater fluxes through the Bering
(thick gray line) and Anadyr Straits (solid black line). Annual mean values of the fluxes are shown
in the upper right corners of the respective boxes. The units are, respectively, 10
6 m
3
/s, 10
20 J, and
10
3 m
3
/s
The Bering Sea Regional Data Assimilation System …
511
in Fig. 5 and include velocity observations from three mooring arrays; multiple
CTD surveys. In addition, we assimilate the gridded SSH anomalies from the
AVISO data set referenced to the regional MDOT and background information
from the reconstructed seasonal climatologies of the Bering Sea (Section “The
Regional 4dVar Data Assimilation System”).
The optimized evolution of the EBS state was obtained by assimilating the above
described data over 49 4-week time windows spanning the period of January 1,
2007 to October 3, 2010. On the average, 300 × 4 = 1200 iterations were required
to achieve the nested 4dVar convergence of a single 4-week problem.
Mass, heat and freshwater transports. The 4dVar-optimized weekly averaged
fluxes are shown in Fig. 6 in the Bering and Anadyr Straits. Because mass is
conserved, and the surface heat/freshwater fluxes in the Northern Bering Sea can be
neglected, the difference between the curves gives an insight on the partitioning of
the respective Bering Strait transports between the Anadyr and Spanberg inflows.
The heat and freshwater transports in Fig. 10 were obtained relative to −1.9 °C and
34.8 psu, respectively.
An interesting feature in Fig. 6 are the events when the Bering Strait fluxes were
much larger than the advective heat/freshwater transports entering the Chirikov
Basin through the Anadyr Strait (e.g., September, November 2007, August–
September 2010). Near-surface circulation and wind stress patterns (Fig. 7a, c)
Fig. 6 Evolution of the weekly averaged mass, heat, and freshwater fluxes through the Bering
(thick gray line) and Anadyr Straits (solid black line). Annual mean values of the fluxes are shown
in the upper right corners of the respective boxes. The units are, respectively, 10
6 m
3
/s, 10
20 J, and
10
3 m
3
/s
The Bering Sea Regional Data Assimilation System …
511