

the bottom. Trajectories of both models were controlled by the initial/boundary
conditions and surface fluxes. The details and validation of the novel two-way nested
DA iterative algorithm were discussed in Panteleev et al. [25]. It was shown that the
nested DA approach allows for a much better reconstruction of the flow through the
Bering Strait and a significant reduction of the model-data observation misfits in
comparison with the BESTMAS data assimilative solution. In the entire range of the
velocity observations from moorings, 4dVar velocities demonstrate a much better
linear fit to the data compared to the one characterizing the BESTMAS solution [25].
The two-way nested 4dVar scheme allowed us to achieve much better consistency between the optimal solutions within the nested domains. As a result, a
significantly better fit was obtained to SSH data, constraining circulation in a coarse
resolution domain, and to higher resolution velocity data controlling the Bering
Strait throughflow.
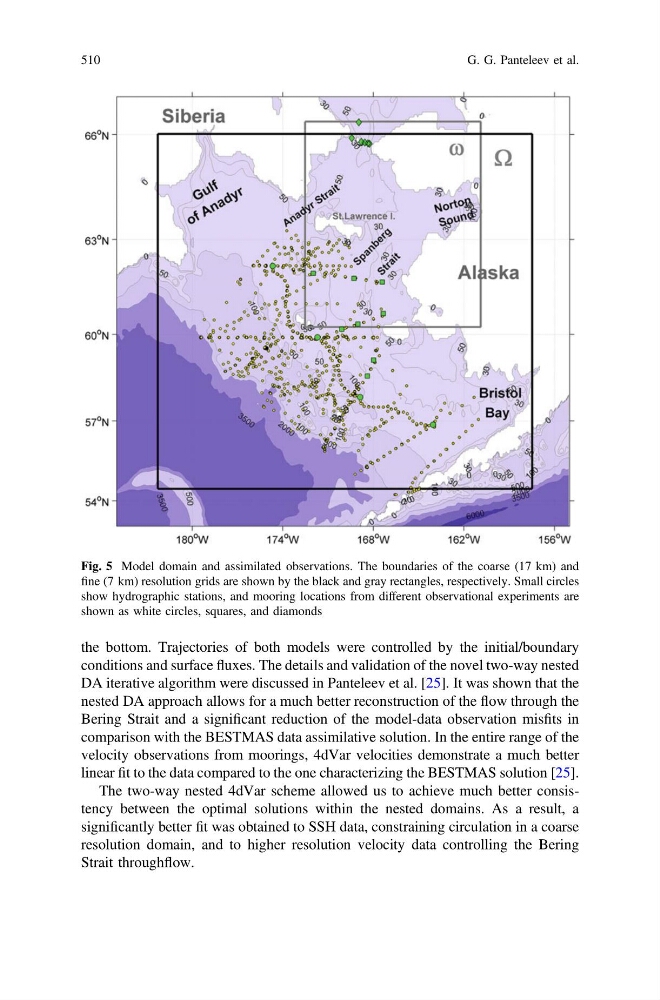
Fig. 5 Model domain and assimilated observations. The boundaries of the coarse (17 km) and
fine (7 km) resolution grids are shown by the black and gray rectangles, respectively. Small circles
show hydrographic stations, and mooring locations from different observational experiments are
shown as white circles, squares, and diamonds
510
G. G. Panteleev et al.
conditions and surface fluxes. The details and validation of the novel two-way nested
DA iterative algorithm were discussed in Panteleev et al. [25]. It was shown that the
nested DA approach allows for a much better reconstruction of the flow through the
Bering Strait and a significant reduction of the model-data observation misfits in
comparison with the BESTMAS data assimilative solution. In the entire range of the
velocity observations from moorings, 4dVar velocities demonstrate a much better
linear fit to the data compared to the one characterizing the BESTMAS solution [25].
The two-way nested 4dVar scheme allowed us to achieve much better consistency between the optimal solutions within the nested domains. As a result, a
significantly better fit was obtained to SSH data, constraining circulation in a coarse
resolution domain, and to higher resolution velocity data controlling the Bering
Strait throughflow.
Fig. 5 Model domain and assimilated observations. The boundaries of the coarse (17 km) and
fine (7 km) resolution grids are shown by the black and gray rectangles, respectively. Small circles
show hydrographic stations, and mooring locations from different observational experiments are
shown as white circles, squares, and diamonds
510
G. G. Panteleev et al.