

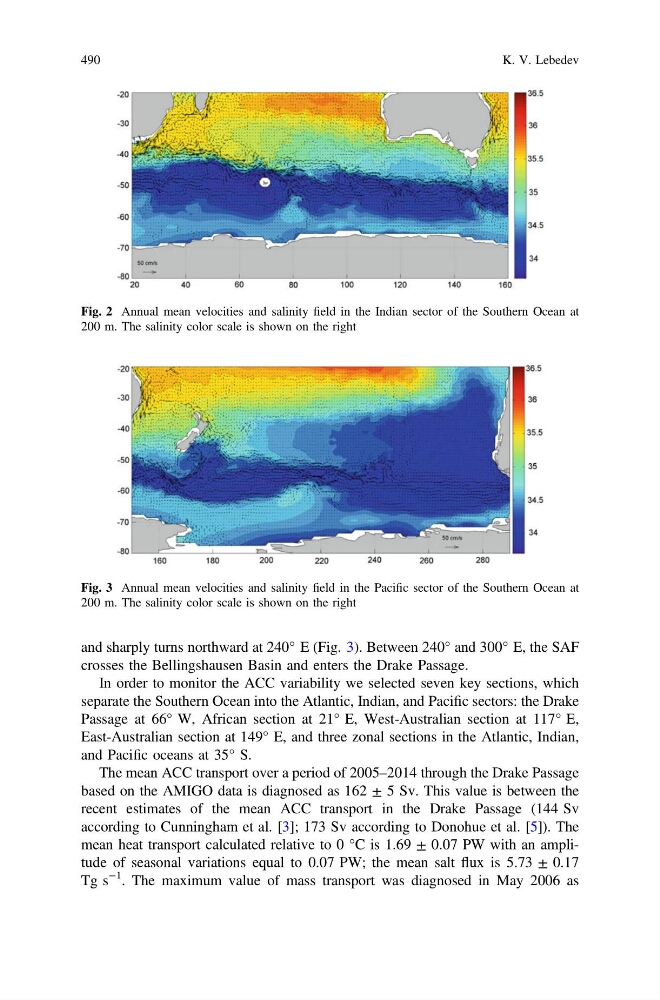
and sharply turns northward at 240° E (Fig. 3). Between 240° and 300° E, the SAF
crosses the Bellingshausen Basin and enters the Drake Passage.
In order to monitor the ACC variability we selected seven key sections, which
separate the Southern Ocean into the Atlantic, Indian, and Pacific sectors: the Drake
Passage at 66° W, African section at 21° E, West-Australian section at 117° E,
East-Australian section at 149° E, and three zonal sections in the Atlantic, Indian,
and Pacific oceans at 35° S.
The mean ACC transport over a period of 2005–2014 through the Drake Passage
based on the AMIGO data is diagnosed as 162 ± 5 Sv. This value is between the
recent estimates of the mean ACC transport in the Drake Passage (144 Sv
according to Cunningham et al. [3]; 173 Sv according to Donohue et al. [5]). The
mean heat transport calculated relative to 0 °C is 1.69 ± 0.07 PW with an amplitude of seasonal variations equal to 0.07 PW; the mean salt flux is 5.73 ± 0.17
Tg s
−1 . The maximum value of mass transport was diagnosed in May 2006 as
Fig. 2 Annual mean velocities and salinity field in the Indian sector of the Southern Ocean at
200 m. The salinity color scale is shown on the right
Fig. 3 Annual mean velocities and salinity field in the Pacific sector of the Southern Ocean at
200 m. The salinity color scale is shown on the right
490
K. V. Lebedev
crosses the Bellingshausen Basin and enters the Drake Passage.
In order to monitor the ACC variability we selected seven key sections, which
separate the Southern Ocean into the Atlantic, Indian, and Pacific sectors: the Drake
Passage at 66° W, African section at 21° E, West-Australian section at 117° E,
East-Australian section at 149° E, and three zonal sections in the Atlantic, Indian,
and Pacific oceans at 35° S.
The mean ACC transport over a period of 2005–2014 through the Drake Passage
based on the AMIGO data is diagnosed as 162 ± 5 Sv. This value is between the
recent estimates of the mean ACC transport in the Drake Passage (144 Sv
according to Cunningham et al. [3]; 173 Sv according to Donohue et al. [5]). The
mean heat transport calculated relative to 0 °C is 1.69 ± 0.07 PW with an amplitude of seasonal variations equal to 0.07 PW; the mean salt flux is 5.73 ± 0.17
Tg s
−1 . The maximum value of mass transport was diagnosed in May 2006 as
Fig. 2 Annual mean velocities and salinity field in the Indian sector of the Southern Ocean at
200 m. The salinity color scale is shown on the right
Fig. 3 Annual mean velocities and salinity field in the Pacific sector of the Southern Ocean at
200 m. The salinity color scale is shown on the right
490
K. V. Lebedev