

model in the diagnostic and hydrodynamic adjustment modes. The new method of
Argo data processing makes it possible to obtain a full set of oceanographic
characteristics: temperature, salinity, and current velocity using irregularly located
Argo measurements.
The simulations were performed for the entire globe limited in the north by
85.5° N using 1° grid spacing both by longitude and latitude. At the depths
exceeding 2000 m, in which the Argo data are lacking, the temperature and salinity
data were taken from the WOA09 database [1, 18]. The constant temperature and
salinity values from the Argo data for the corresponding month (year, season)
derived using the variational technique described above were specified as the
boundary conditions at the ocean surface. The constant wind stress in the corresponding month (year, season) was specified from the ECMWF ERA-Interim
reanalysis data [4].
Results
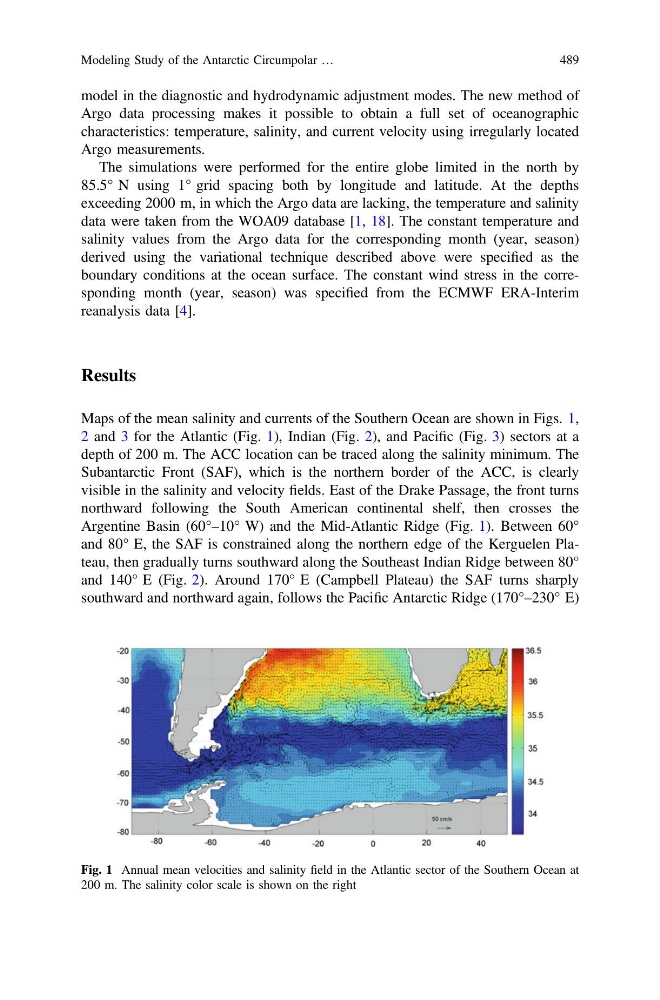
Maps of the mean salinity and currents of the Southern Ocean are shown in Figs. 1,
2 and 3 for the Atlantic (Fig. 1), Indian (Fig. 2), and Pacific (Fig. 3) sectors at a
depth of 200 m. The ACC location can be traced along the salinity minimum. The
Subantarctic Front (SAF), which is the northern border of the ACC, is clearly
visible in the salinity and velocity fields. East of the Drake Passage, the front turns
northward following the South American continental shelf, then crosses the
Argentine Basin (60°–10° W) and the Mid-Atlantic Ridge (Fig. 1). Between 60°
and 80° E, the SAF is constrained along the northern edge of the Kerguelen Plateau, then gradually turns southward along the Southeast Indian Ridge between 80°
and 140° E (Fig. 2). Around 170° E (Campbell Plateau) the SAF turns sharply
southward and northward again, follows the Pacific Antarctic Ridge (170°–230° E)
Fig. 1 Annual mean velocities and salinity field in the Atlantic sector of the Southern Ocean at
200 m. The salinity color scale is shown on the right
Modeling Study of the Antarctic Circumpolar …
489
Argo data processing makes it possible to obtain a full set of oceanographic
characteristics: temperature, salinity, and current velocity using irregularly located
Argo measurements.
The simulations were performed for the entire globe limited in the north by
85.5° N using 1° grid spacing both by longitude and latitude. At the depths
exceeding 2000 m, in which the Argo data are lacking, the temperature and salinity
data were taken from the WOA09 database [1, 18]. The constant temperature and
salinity values from the Argo data for the corresponding month (year, season)
derived using the variational technique described above were specified as the
boundary conditions at the ocean surface. The constant wind stress in the corresponding month (year, season) was specified from the ECMWF ERA-Interim
reanalysis data [4].
Results
Maps of the mean salinity and currents of the Southern Ocean are shown in Figs. 1,
2 and 3 for the Atlantic (Fig. 1), Indian (Fig. 2), and Pacific (Fig. 3) sectors at a
depth of 200 m. The ACC location can be traced along the salinity minimum. The
Subantarctic Front (SAF), which is the northern border of the ACC, is clearly
visible in the salinity and velocity fields. East of the Drake Passage, the front turns
northward following the South American continental shelf, then crosses the
Argentine Basin (60°–10° W) and the Mid-Atlantic Ridge (Fig. 1). Between 60°
and 80° E, the SAF is constrained along the northern edge of the Kerguelen Plateau, then gradually turns southward along the Southeast Indian Ridge between 80°
and 140° E (Fig. 2). Around 170° E (Campbell Plateau) the SAF turns sharply
southward and northward again, follows the Pacific Antarctic Ridge (170°–230° E)
Fig. 1 Annual mean velocities and salinity field in the Atlantic sector of the Southern Ocean at
200 m. The salinity color scale is shown on the right
Modeling Study of the Antarctic Circumpolar …
489