

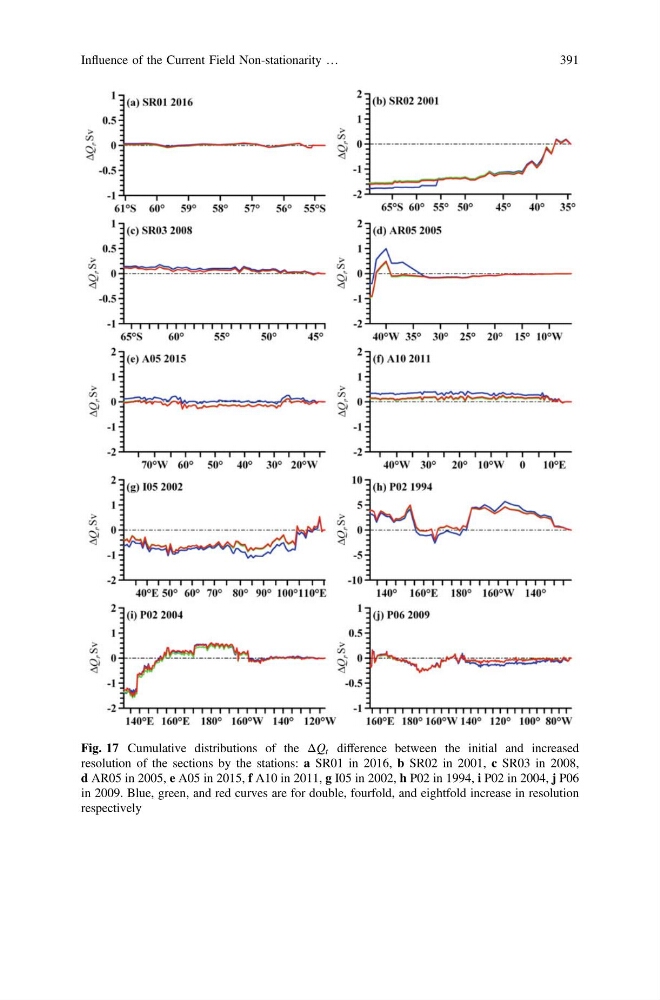
Fig. 17 Cumulative distributions of the ΔQ t difference between the initial and increased
resolution of the sections by the stations: a SR01 in 2016, b SR02 in 2001, c SR03 in 2008,
d AR05 in 2005, e A05 in 2015, f A10 in 2011, g I05 in 2002, h P02 in 1994, i P02 in 2004, j P06
in 2009. Blue, green, and red curves are for double, fourfold, and eightfold increase in resolution
respectively
Influence of the Current Field Non-stationarity …
391
resolution of the sections by the stations: a SR01 in 2016, b SR02 in 2001, c SR03 in 2008,
d AR05 in 2005, e A05 in 2015, f A10 in 2011, g I05 in 2002, h P02 in 1994, i P02 in 2004, j P06
in 2009. Blue, green, and red curves are for double, fourfold, and eightfold increase in resolution
respectively
Influence of the Current Field Non-stationarity …
391