

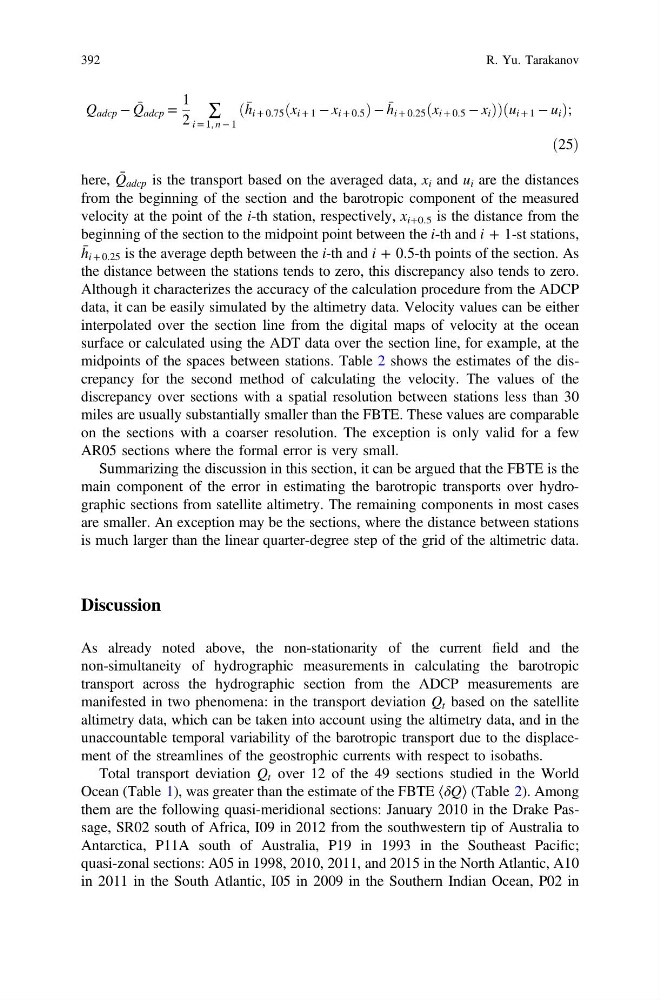
Q adcp − Q ̄ adcp =
1
2
∑
i = 1, n − 1
h ̄
i + 0.75 x i + 1 − x i + 0.5
ð
Þ − h ̄
i + 0.25 x i + 0.5 − x i
ð
Þ
ð
Þ u i + 1 − u i
ð
Þ ;
ð25Þ
here, Q ̄
adcp is the transport based on the averaged data, x i and u i are the distances
from the beginning of the section and the barotropic component of the measured
velocity at the point of the i-th station, respectively, x i+0.5 is the distance from the
beginning of the section to the midpoint point between the i-th and i + 1-st stations,
h ̄
i + 0.25 is the average depth between the i-th and i + 0.5-th points of the section. As
the distance between the stations tends to zero, this discrepancy also tends to zero.
Although it characterizes the accuracy of the calculation procedure from the ADCP
data, it can be easily simulated by the altimetry data. Velocity values can be either
interpolated over the section line from the digital maps of velocity at the ocean
surface or calculated using the ADT data over the section line, for example, at the
midpoints of the spaces between stations. Table 2 shows the estimates of the discrepancy for the second method of calculating the velocity. The values of the
discrepancy over sections with a spatial resolution between stations less than 30
miles are usually substantially smaller than the FBTE. These values are comparable
on the sections with a coarser resolution. The exception is only valid for a few
AR05 sections where the formal error is very small.
Summarizing the discussion in this section, it can be argued that the FBTE is the
main component of the error in estimating the barotropic transports over hydrographic sections from satellite altimetry. The remaining components in most cases
are smaller. An exception may be the sections, where the distance between stations
is much larger than the linear quarter-degree step of the grid of the altimetric data.
Discussion
As already noted above, the non-stationarity of the current field and the
non-simultaneity of hydrographic measurements in calculating the barotropic
transport across the hydrographic section from the ADCP measurements are
manifested in two phenomena: in the transport deviation Q t based on the satellite
altimetry data, which can be taken into account using the altimetry data, and in the
unaccountable temporal variability of the barotropic transport due to the displacement of the streamlines of the geostrophic currents with respect to isobaths.
Total transport deviation Q t over 12 of the 49 sections studied in the World
Ocean (Table 1), was greater than the estimate of the FBTE ⟨δQ⟩ (Table 2). Among
them are the following quasi-meridional sections: January 2010 in the Drake Passage, SR02 south of Africa, I09 in 2012 from the southwestern tip of Australia to
Antarctica, P11A south of Australia, P19 in 1993 in the Southeast Pacific;
quasi-zonal sections: A05 in 1998, 2010, 2011, and 2015 in the North Atlantic, A10
in 2011 in the South Atlantic, I05 in 2009 in the Southern Indian Ocean, P02 in
392
R. Yu. Tarakanov
1
2
∑
i = 1, n − 1
h ̄
i + 0.75 x i + 1 − x i + 0.5
ð
Þ − h ̄
i + 0.25 x i + 0.5 − x i
ð
Þ
ð
Þ u i + 1 − u i
ð
Þ ;
ð25Þ
here, Q ̄
adcp is the transport based on the averaged data, x i and u i are the distances
from the beginning of the section and the barotropic component of the measured
velocity at the point of the i-th station, respectively, x i+0.5 is the distance from the
beginning of the section to the midpoint point between the i-th and i + 1-st stations,
h ̄
i + 0.25 is the average depth between the i-th and i + 0.5-th points of the section. As
the distance between the stations tends to zero, this discrepancy also tends to zero.
Although it characterizes the accuracy of the calculation procedure from the ADCP
data, it can be easily simulated by the altimetry data. Velocity values can be either
interpolated over the section line from the digital maps of velocity at the ocean
surface or calculated using the ADT data over the section line, for example, at the
midpoints of the spaces between stations. Table 2 shows the estimates of the discrepancy for the second method of calculating the velocity. The values of the
discrepancy over sections with a spatial resolution between stations less than 30
miles are usually substantially smaller than the FBTE. These values are comparable
on the sections with a coarser resolution. The exception is only valid for a few
AR05 sections where the formal error is very small.
Summarizing the discussion in this section, it can be argued that the FBTE is the
main component of the error in estimating the barotropic transports over hydrographic sections from satellite altimetry. The remaining components in most cases
are smaller. An exception may be the sections, where the distance between stations
is much larger than the linear quarter-degree step of the grid of the altimetric data.
Discussion
As already noted above, the non-stationarity of the current field and the
non-simultaneity of hydrographic measurements in calculating the barotropic
transport across the hydrographic section from the ADCP measurements are
manifested in two phenomena: in the transport deviation Q t based on the satellite
altimetry data, which can be taken into account using the altimetry data, and in the
unaccountable temporal variability of the barotropic transport due to the displacement of the streamlines of the geostrophic currents with respect to isobaths.
Total transport deviation Q t over 12 of the 49 sections studied in the World
Ocean (Table 1), was greater than the estimate of the FBTE ⟨δQ⟩ (Table 2). Among
them are the following quasi-meridional sections: January 2010 in the Drake Passage, SR02 south of Africa, I09 in 2012 from the southwestern tip of Australia to
Antarctica, P11A south of Australia, P19 in 1993 in the Southeast Pacific;
quasi-zonal sections: A05 in 1998, 2010, 2011, and 2015 in the North Atlantic, A10
in 2011 in the South Atlantic, I05 in 2009 in the Southern Indian Ocean, P02 in
392
R. Yu. Tarakanov