

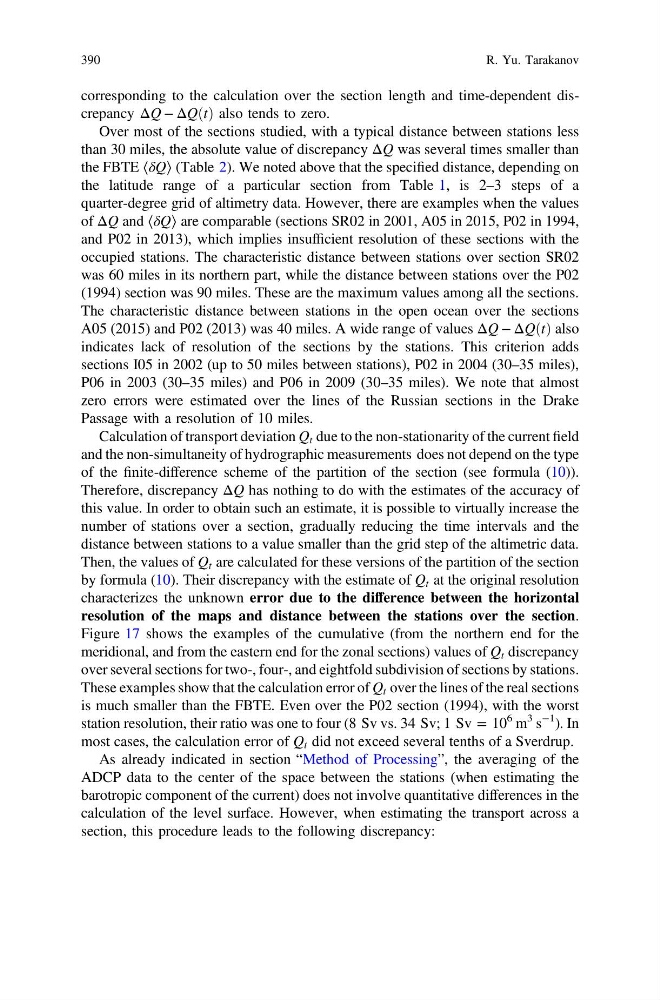
corresponding to the calculation over the section length and time-dependent discrepancy ΔQ − ΔQ t
ð Þ also tends to zero.
Over most of the sections studied, with a typical distance between stations less
than 30 miles, the absolute value of discrepancy ΔQ was several times smaller than
the FBTE ⟨δQ⟩ (Table 2). We noted above that the specified distance, depending on
the latitude range of a particular section from Table 1, is 2–3 steps of a
quarter-degree grid of altimetry data. However, there are examples when the values
of ΔQ and ⟨δQ⟩ are comparable (sections SR02 in 2001, A05 in 2015, P02 in 1994,
and P02 in 2013), which implies insufficient resolution of these sections with the
occupied stations. The characteristic distance between stations over section SR02
was 60 miles in its northern part, while the distance between stations over the P02
(1994) section was 90 miles. These are the maximum values among all the sections.
The characteristic distance between stations in the open ocean over the sections
A05 (2015) and P02 (2013) was 40 miles. A wide range of values ΔQ − ΔQ t
ð Þ also
indicates lack of resolution of the sections by the stations. This criterion adds
sections I05 in 2002 (up to 50 miles between stations), P02 in 2004 (30–35 miles),
P06 in 2003 (30–35 miles) and P06 in 2009 (30–35 miles). We note that almost
zero errors were estimated over the lines of the Russian sections in the Drake
Passage with a resolution of 10 miles.
Calculation of transport deviation Q t due to the non-stationarity of the current field
and the non-simultaneity of hydrographic measurements does not depend on the type
of the finite-difference scheme of the partition of the section (see formula (10)).
Therefore, discrepancy ΔQ has nothing to do with the estimates of the accuracy of
this value. In order to obtain such an estimate, it is possible to virtually increase the
number of stations over a section, gradually reducing the time intervals and the
distance between stations to a value smaller than the grid step of the altimetric data.
Then, the values of Q t are calculated for these versions of the partition of the section
by formula (10). Their discrepancy with the estimate of Q t at the original resolution
characterizes the unknown error due to the difference between the horizontal
resolution of the maps and distance between the stations over the section.
Figure 17 shows the examples of the cumulative (from the northern end for the
meridional, and from the eastern end for the zonal sections) values of Q t discrepancy
over several sections for two-, four-, and eightfold subdivision of sections by stations.
These examples show that the calculation error of Q t over the lines of the real sections
is much smaller than the FBTE. Even over the P02 section (1994), with the worst
station resolution, their ratio was one to four (8 Sv vs. 34 Sv; 1 Sv = 10
6 m
3 s
−1 ). In
most cases, the calculation error of Q t did not exceed several tenths of a Sverdrup.
As already indicated in section “Method of Processing”, the averaging of the
ADCP data to the center of the space between the stations (when estimating the
barotropic component of the current) does not involve quantitative differences in the
calculation of the level surface. However, when estimating the transport across a
section, this procedure leads to the following discrepancy:
390
R. Yu. Tarakanov
ð Þ also tends to zero.
Over most of the sections studied, with a typical distance between stations less
than 30 miles, the absolute value of discrepancy ΔQ was several times smaller than
the FBTE ⟨δQ⟩ (Table 2). We noted above that the specified distance, depending on
the latitude range of a particular section from Table 1, is 2–3 steps of a
quarter-degree grid of altimetry data. However, there are examples when the values
of ΔQ and ⟨δQ⟩ are comparable (sections SR02 in 2001, A05 in 2015, P02 in 1994,
and P02 in 2013), which implies insufficient resolution of these sections with the
occupied stations. The characteristic distance between stations over section SR02
was 60 miles in its northern part, while the distance between stations over the P02
(1994) section was 90 miles. These are the maximum values among all the sections.
The characteristic distance between stations in the open ocean over the sections
A05 (2015) and P02 (2013) was 40 miles. A wide range of values ΔQ − ΔQ t
ð Þ also
indicates lack of resolution of the sections by the stations. This criterion adds
sections I05 in 2002 (up to 50 miles between stations), P02 in 2004 (30–35 miles),
P06 in 2003 (30–35 miles) and P06 in 2009 (30–35 miles). We note that almost
zero errors were estimated over the lines of the Russian sections in the Drake
Passage with a resolution of 10 miles.
Calculation of transport deviation Q t due to the non-stationarity of the current field
and the non-simultaneity of hydrographic measurements does not depend on the type
of the finite-difference scheme of the partition of the section (see formula (10)).
Therefore, discrepancy ΔQ has nothing to do with the estimates of the accuracy of
this value. In order to obtain such an estimate, it is possible to virtually increase the
number of stations over a section, gradually reducing the time intervals and the
distance between stations to a value smaller than the grid step of the altimetric data.
Then, the values of Q t are calculated for these versions of the partition of the section
by formula (10). Their discrepancy with the estimate of Q t at the original resolution
characterizes the unknown error due to the difference between the horizontal
resolution of the maps and distance between the stations over the section.
Figure 17 shows the examples of the cumulative (from the northern end for the
meridional, and from the eastern end for the zonal sections) values of Q t discrepancy
over several sections for two-, four-, and eightfold subdivision of sections by stations.
These examples show that the calculation error of Q t over the lines of the real sections
is much smaller than the FBTE. Even over the P02 section (1994), with the worst
station resolution, their ratio was one to four (8 Sv vs. 34 Sv; 1 Sv = 10
6 m
3 s
−1 ). In
most cases, the calculation error of Q t did not exceed several tenths of a Sverdrup.
As already indicated in section “Method of Processing”, the averaging of the
ADCP data to the center of the space between the stations (when estimating the
barotropic component of the current) does not involve quantitative differences in the
calculation of the level surface. However, when estimating the transport across a
section, this procedure leads to the following discrepancy:
390
R. Yu. Tarakanov