

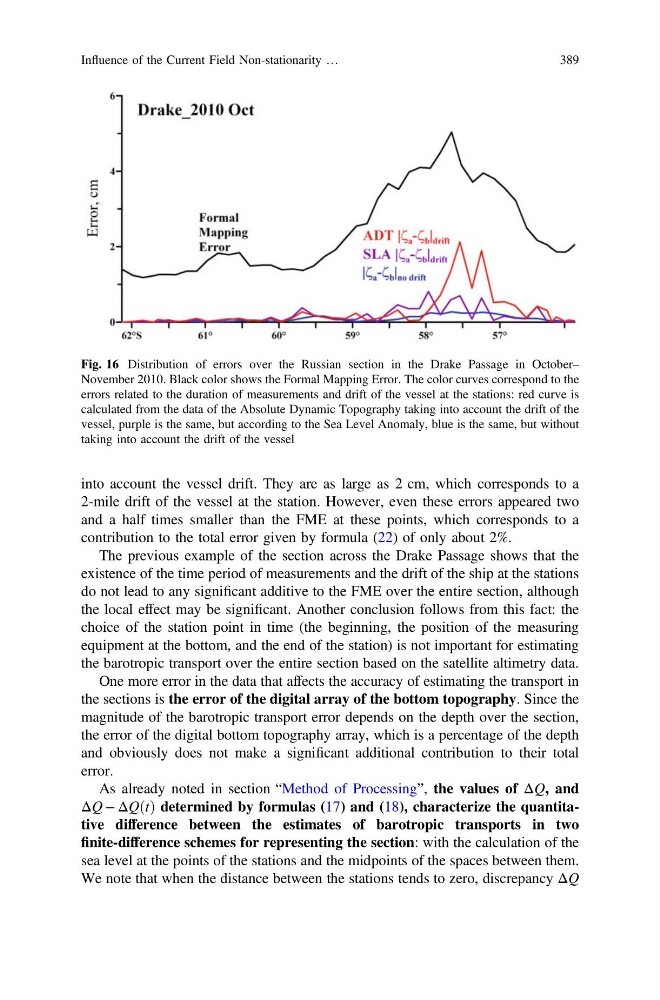
into account the vessel drift. They are as large as 2 cm, which corresponds to a
2-mile drift of the vessel at the station. However, even these errors appeared two
and a half times smaller than the FME at these points, which corresponds to a
contribution to the total error given by formula (22) of only about 2%.
The previous example of the section across the Drake Passage shows that the
existence of the time period of measurements and the drift of the ship at the stations
do not lead to any significant additive to the FME over the entire section, although
the local effect may be significant. Another conclusion follows from this fact: the
choice of the station point in time (the beginning, the position of the measuring
equipment at the bottom, and the end of the station) is not important for estimating
the barotropic transport over the entire section based on the satellite altimetry data.
One more error in the data that affects the accuracy of estimating the transport in
the sections is the error of the digital array of the bottom topography. Since the
magnitude of the barotropic transport error depends on the depth over the section,
the error of the digital bottom topography array, which is a percentage of the depth
and obviously does not make a significant additional contribution to their total
error.
As already noted in section “Method of Processing”, the values of ΔQ, and
ΔQ − ΔQ t
ð Þ determined by formulas (17) and (18), characterize the quantitative difference between the estimates of barotropic transports in two
finite-difference schemes for representing the section: with the calculation of the
sea level at the points of the stations and the midpoints of the spaces between them.
We note that when the distance between the stations tends to zero, discrepancy ΔQ
Fig. 16 Distribution of errors over the Russian section in the Drake Passage in October–
November 2010. Black color shows the Formal Mapping Error. The color curves correspond to the
errors related to the duration of measurements and drift of the vessel at the stations: red curve is
calculated from the data of the Absolute Dynamic Topography taking into account the drift of the
vessel, purple is the same, but according to the Sea Level Anomaly, blue is the same, but without
taking into account the drift of the vessel
Influence of the Current Field Non-stationarity …
389
2-mile drift of the vessel at the station. However, even these errors appeared two
and a half times smaller than the FME at these points, which corresponds to a
contribution to the total error given by formula (22) of only about 2%.
The previous example of the section across the Drake Passage shows that the
existence of the time period of measurements and the drift of the ship at the stations
do not lead to any significant additive to the FME over the entire section, although
the local effect may be significant. Another conclusion follows from this fact: the
choice of the station point in time (the beginning, the position of the measuring
equipment at the bottom, and the end of the station) is not important for estimating
the barotropic transport over the entire section based on the satellite altimetry data.
One more error in the data that affects the accuracy of estimating the transport in
the sections is the error of the digital array of the bottom topography. Since the
magnitude of the barotropic transport error depends on the depth over the section,
the error of the digital bottom topography array, which is a percentage of the depth
and obviously does not make a significant additional contribution to their total
error.
As already noted in section “Method of Processing”, the values of ΔQ, and
ΔQ − ΔQ t
ð Þ determined by formulas (17) and (18), characterize the quantitative difference between the estimates of barotropic transports in two
finite-difference schemes for representing the section: with the calculation of the
sea level at the points of the stations and the midpoints of the spaces between them.
We note that when the distance between the stations tends to zero, discrepancy ΔQ
Fig. 16 Distribution of errors over the Russian section in the Drake Passage in October–
November 2010. Black color shows the Formal Mapping Error. The color curves correspond to the
errors related to the duration of measurements and drift of the vessel at the stations: red curve is
calculated from the data of the Absolute Dynamic Topography taking into account the drift of the
vessel, purple is the same, but according to the Sea Level Anomaly, blue is the same, but without
taking into account the drift of the vessel
Influence of the Current Field Non-stationarity …
389