

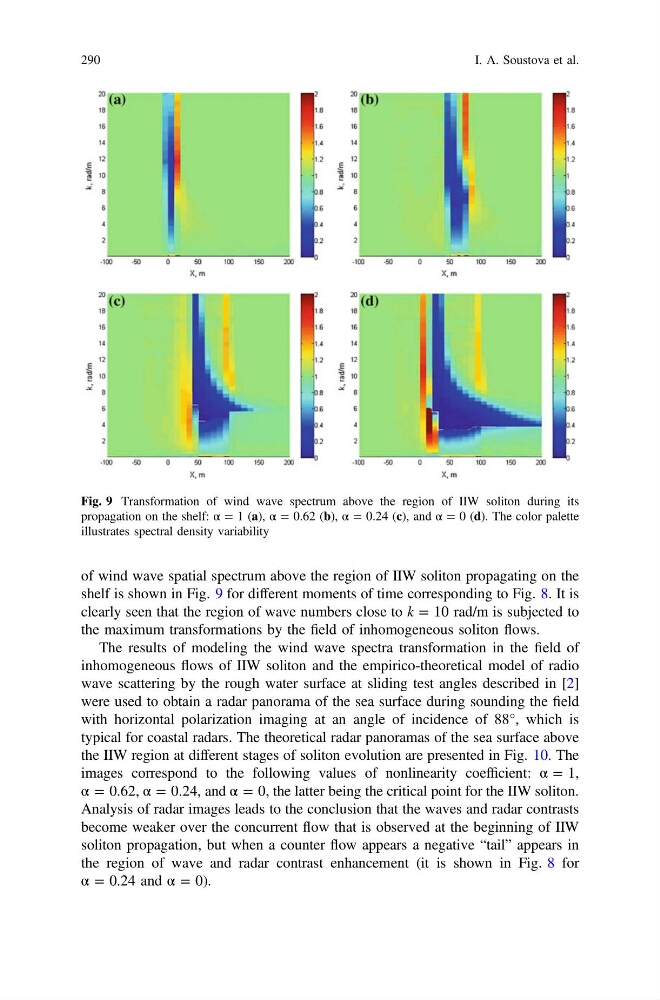
of wind wave spatial spectrum above the region of IIW soliton propagating on the
shelf is shown in Fig. 9 for different moments of time corresponding to Fig. 8. It is
clearly seen that the region of wave numbers close to k = 10 rad/m is subjected to
the maximum transformations by the field of inhomogeneous soliton flows.
The results of modeling the wind wave spectra transformation in the field of
inhomogeneous flows of IIW soliton and the empirico-theoretical model of radio
wave scattering by the rough water surface at sliding test angles described in [2]
were used to obtain a radar panorama of the sea surface during sounding the field
with horizontal polarization imaging at an angle of incidence of 88°, which is
typical for coastal radars. The theoretical radar panoramas of the sea surface above
the IIW region at different stages of soliton evolution are presented in Fig. 10. The
images correspond to the following values of nonlinearity coefficient: α = 1,
α = 0.62, α = 0.24, and α = 0, the latter being the critical point for the IIW soliton.
Analysis of radar images leads to the conclusion that the waves and radar contrasts
become weaker over the concurrent flow that is observed at the beginning of IIW
soliton propagation, but when a counter flow appears a negative “tail” appears in
the region of wave and radar contrast enhancement (it is shown in Fig. 8 for
α = 0.24 and α = 0).
Fig. 9 Transformation of wind wave spectrum above the region of IIW soliton during its
propagation on the shelf: α = 1 (a), α = 0.62 (b), α = 0.24 (c), and α = 0 (d). The color palette
illustrates spectral density variability
290
I. A. Soustova et al.
shelf is shown in Fig. 9 for different moments of time corresponding to Fig. 8. It is
clearly seen that the region of wave numbers close to k = 10 rad/m is subjected to
the maximum transformations by the field of inhomogeneous soliton flows.
The results of modeling the wind wave spectra transformation in the field of
inhomogeneous flows of IIW soliton and the empirico-theoretical model of radio
wave scattering by the rough water surface at sliding test angles described in [2]
were used to obtain a radar panorama of the sea surface during sounding the field
with horizontal polarization imaging at an angle of incidence of 88°, which is
typical for coastal radars. The theoretical radar panoramas of the sea surface above
the IIW region at different stages of soliton evolution are presented in Fig. 10. The
images correspond to the following values of nonlinearity coefficient: α = 1,
α = 0.62, α = 0.24, and α = 0, the latter being the critical point for the IIW soliton.
Analysis of radar images leads to the conclusion that the waves and radar contrasts
become weaker over the concurrent flow that is observed at the beginning of IIW
soliton propagation, but when a counter flow appears a negative “tail” appears in
the region of wave and radar contrast enhancement (it is shown in Fig. 8 for
α = 0.24 and α = 0).
Fig. 9 Transformation of wind wave spectrum above the region of IIW soliton during its
propagation on the shelf: α = 1 (a), α = 0.62 (b), α = 0.24 (c), and α = 0 (d). The color palette
illustrates spectral density variability
290
I. A. Soustova et al.