

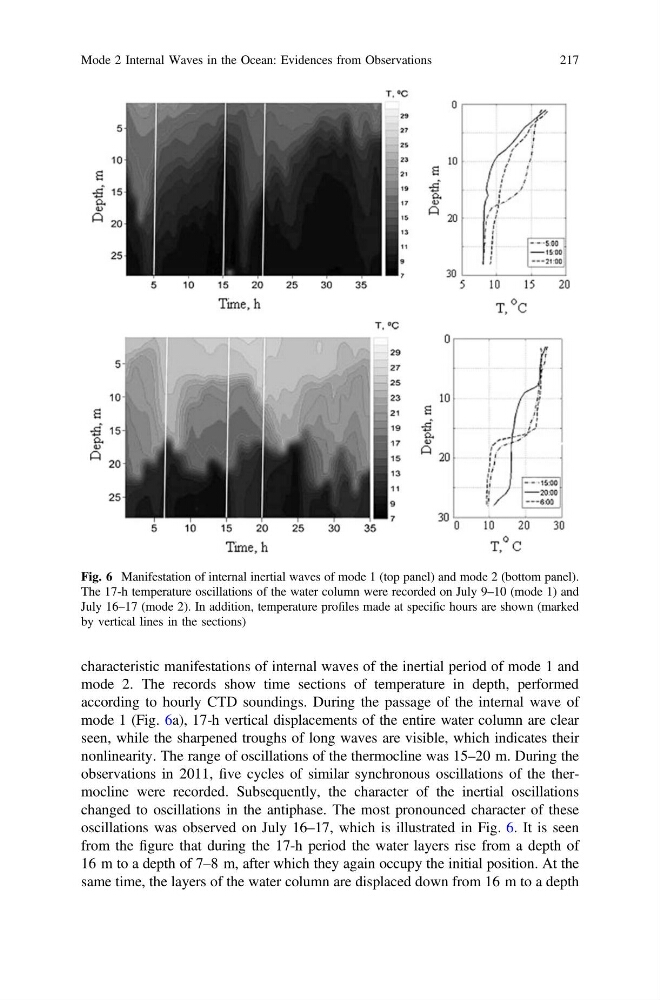
characteristic manifestations of internal waves of the inertial period of mode 1 and
mode 2. The records show time sections of temperature in depth, performed
according to hourly CTD soundings. During the passage of the internal wave of
mode 1 (Fig. 6a), 17-h vertical displacements of the entire water column are clear
seen, while the sharpened troughs of long waves are visible, which indicates their
nonlinearity. The range of oscillations of the thermocline was 15–20 m. During the
observations in 2011, five cycles of similar synchronous oscillations of the thermocline were recorded. Subsequently, the character of the inertial oscillations
changed to oscillations in the antiphase. The most pronounced character of these
oscillations was observed on July 16–17, which is illustrated in Fig. 6. It is seen
from the figure that during the 17-h period the water layers rise from a depth of
16 m to a depth of 7–8 m, after which they again occupy the initial position. At the
same time, the layers of the water column are displaced down from 16 m to a depth
Fig. 6 Manifestation of internal inertial waves of mode 1 (top panel) and mode 2 (bottom panel).
The 17-h temperature oscillations of the water column were recorded on July 9–10 (mode 1) and
July 16–17 (mode 2). In addition, temperature profiles made at specific hours are shown (marked
by vertical lines in the sections)
Mode 2 Internal Waves in the Ocean: Evidences from Observations
217
mode 2. The records show time sections of temperature in depth, performed
according to hourly CTD soundings. During the passage of the internal wave of
mode 1 (Fig. 6a), 17-h vertical displacements of the entire water column are clear
seen, while the sharpened troughs of long waves are visible, which indicates their
nonlinearity. The range of oscillations of the thermocline was 15–20 m. During the
observations in 2011, five cycles of similar synchronous oscillations of the thermocline were recorded. Subsequently, the character of the inertial oscillations
changed to oscillations in the antiphase. The most pronounced character of these
oscillations was observed on July 16–17, which is illustrated in Fig. 6. It is seen
from the figure that during the 17-h period the water layers rise from a depth of
16 m to a depth of 7–8 m, after which they again occupy the initial position. At the
same time, the layers of the water column are displaced down from 16 m to a depth
Fig. 6 Manifestation of internal inertial waves of mode 1 (top panel) and mode 2 (bottom panel).
The 17-h temperature oscillations of the water column were recorded on July 9–10 (mode 1) and
July 16–17 (mode 2). In addition, temperature profiles made at specific hours are shown (marked
by vertical lines in the sections)
Mode 2 Internal Waves in the Ocean: Evidences from Observations
217