

THE NEAR-SURFACE LAYER OF THE OCEAN
maximum of the skewness seems to be shifted to the right by 10-20
o .This
can be explained by the fact that away from the equator the wind drift
current direction differs from the wind velocity vector direction because of
the Ekman spiral (see Section 1.7.1). Data scatter in both figures is,
however, marginal for making final conclusions.
5.6.4 Vertical profiles
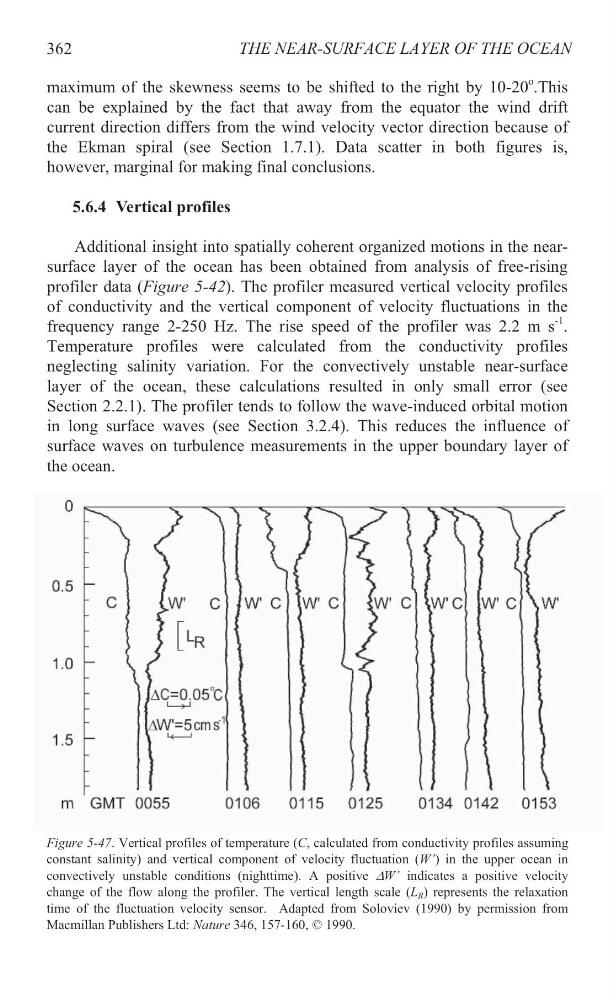
Additional insight into spatially coherent organized motions in the nearsurface layer of the ocean has been obtained from analysis of free-rising
profiler data (Figure 5-42). The profiler measured vertical velocity profiles
of conductivity and the vertical component of velocity fluctuations in the
frequency range 2-250 Hz. The rise speed of the profiler was 2.2 m s
-1 .
Temperature profiles were calculated from the conductivity profiles
neglecting salinity variation. For the convectively unstable near-surface
layer of the ocean, these calculations resulted in only small error (see
Section 2.2.1). The profiler tends to follow the wave-induced orbital motion
in long surface waves (see Section 3.2.4). This reduces the influence of
surface waves on turbulence measurements in the upper boundary layer of
the ocean.
362
Figure 5-47. Vertical profiles of temperature (C, calculated from conductivity profiles assuming
constant salinity) and vertical component of velocity fluctuation (W’) in the upper ocean in
convectively unstable conditions (nighttime). A positive 'W’ indicates a positive velocity
change of the flow along the profiler. The vertical length scale (L R ) represents the relaxation
time of the fluctuation velocity sensor. Adapted from Soloviev (1990) by permission from
Macmillan Publishers Ltd: Nature 346, 157-160, © 1990.
maximum of the skewness seems to be shifted to the right by 10-20
o .This
can be explained by the fact that away from the equator the wind drift
current direction differs from the wind velocity vector direction because of
the Ekman spiral (see Section 1.7.1). Data scatter in both figures is,
however, marginal for making final conclusions.
5.6.4 Vertical profiles
Additional insight into spatially coherent organized motions in the nearsurface layer of the ocean has been obtained from analysis of free-rising
profiler data (Figure 5-42). The profiler measured vertical velocity profiles
of conductivity and the vertical component of velocity fluctuations in the
frequency range 2-250 Hz. The rise speed of the profiler was 2.2 m s
-1 .
Temperature profiles were calculated from the conductivity profiles
neglecting salinity variation. For the convectively unstable near-surface
layer of the ocean, these calculations resulted in only small error (see
Section 2.2.1). The profiler tends to follow the wave-induced orbital motion
in long surface waves (see Section 3.2.4). This reduces the influence of
surface waves on turbulence measurements in the upper boundary layer of
the ocean.
362
Figure 5-47. Vertical profiles of temperature (C, calculated from conductivity profiles assuming
constant salinity) and vertical component of velocity fluctuation (W’) in the upper ocean in
convectively unstable conditions (nighttime). A positive 'W’ indicates a positive velocity
change of the flow along the profiler. The vertical length scale (L R ) represents the relaxation
time of the fluctuation velocity sensor. Adapted from Soloviev (1990) by permission from
Macmillan Publishers Ltd: Nature 346, 157-160, © 1990.