

Chapter 5. SPATIALLY-COHERENT STRUCTURES
Figure 5-47 shows a series of measurements of temperature and vertical
velocity fluctuations made by free-rising profiler at 20
o N, 37
o W in the early
morning hours. The weather conditions were similar to those during the
measurements shown in Figure 5-43. The time interval between successive
measurements was ~10 min, and the vessel drift during this time period was
several tens of meters. The structures investigated supposedly had time and
space scales of the same order. From these data, it would then be difficult to
trace any space-time connections between the successive vertical profiles in
relation to ramp-like structures.
Figure 5-47 suggests that in a few cases the profiler crossed the
temperature interfaces presumably related to ramp-like structures. In
particular, in the profiles obtained at 00:55 and 01:25 UTC, the temperature
interfaces were correlated with abrupt vertical velocity features. In the
interpretation of the velocity profiles it is important to remember that the
sensor measured only velocity fluctuations within the frequency range 2 to
250 Hz. Since the profiler moved quickly with respect to the water (at a 2.2
m s
-1 vertical speed), abrupt velocity changes were observed correctly.
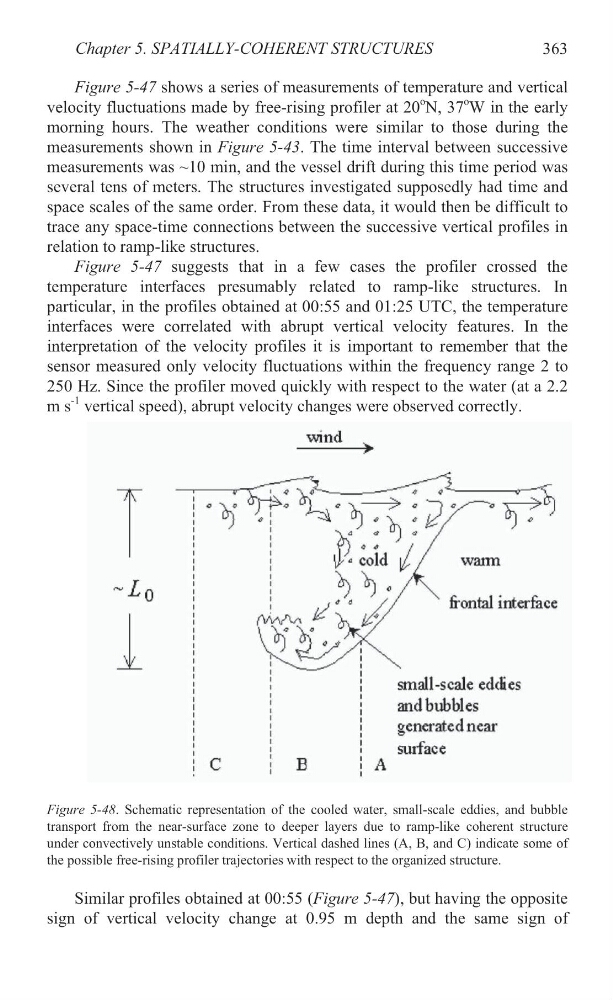
Figure 5-48. Schematic representation of the cooled water, small-scale eddies, and bubble
transport from the near-surface zone to deeper layers due to ramp-like coherent structure
under convectively unstable conditions. Vertical dashed lines (A, B, and C) indicate some of
the possible free-rising profiler trajectories with respect to the organized structure.
Similar profiles obtained at 00:55 (Figure 5-47), but having the opposite
sign of vertical velocity change at 0.95 m depth and the same sign of
363
Figure 5-47 shows a series of measurements of temperature and vertical
velocity fluctuations made by free-rising profiler at 20
o N, 37
o W in the early
morning hours. The weather conditions were similar to those during the
measurements shown in Figure 5-43. The time interval between successive
measurements was ~10 min, and the vessel drift during this time period was
several tens of meters. The structures investigated supposedly had time and
space scales of the same order. From these data, it would then be difficult to
trace any space-time connections between the successive vertical profiles in
relation to ramp-like structures.
Figure 5-47 suggests that in a few cases the profiler crossed the
temperature interfaces presumably related to ramp-like structures. In
particular, in the profiles obtained at 00:55 and 01:25 UTC, the temperature
interfaces were correlated with abrupt vertical velocity features. In the
interpretation of the velocity profiles it is important to remember that the
sensor measured only velocity fluctuations within the frequency range 2 to
250 Hz. Since the profiler moved quickly with respect to the water (at a 2.2
m s
-1 vertical speed), abrupt velocity changes were observed correctly.
Figure 5-48. Schematic representation of the cooled water, small-scale eddies, and bubble
transport from the near-surface zone to deeper layers due to ramp-like coherent structure
under convectively unstable conditions. Vertical dashed lines (A, B, and C) indicate some of
the possible free-rising profiler trajectories with respect to the organized structure.
Similar profiles obtained at 00:55 (Figure 5-47), but having the opposite
sign of vertical velocity change at 0.95 m depth and the same sign of
363