

Chapter 5. SPATIALLY-COHERENT STRUCTURES
surface cooling, which is opposite to its atmospheric counterpart where the
unstable stratification is due to warming of the underlying surface. The
reason for the reversion of the time coordinate in the oceanic data series is
that the ship was traveling into the wind; the bow sensors crossed the
structures in the ocean layer in the direction opposite to the relative direction
of the air flow during the measurements with a fixed sensor in the Antonia et
al. (1979) experiment (Figure 5-43c).
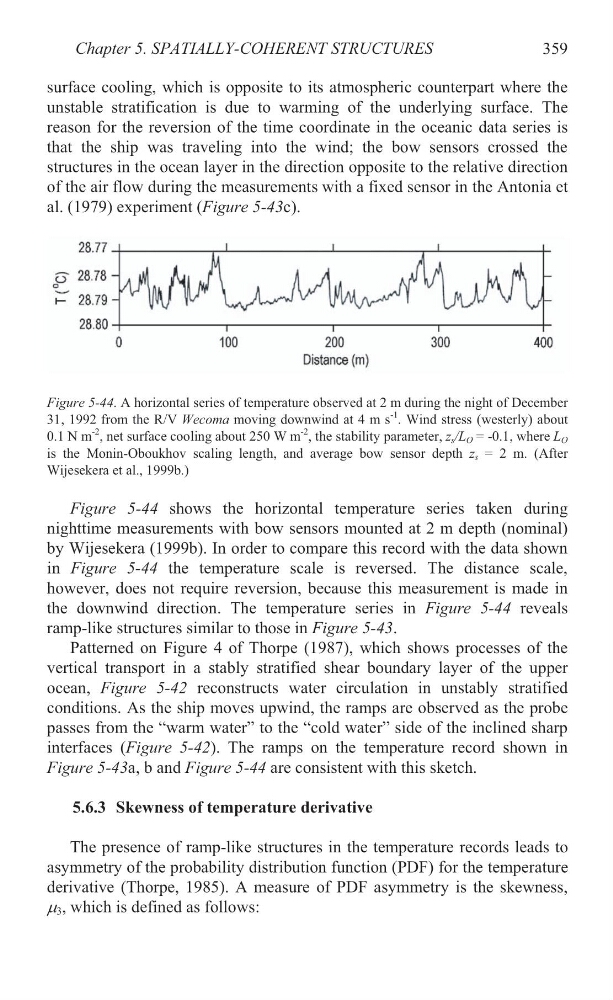
Figure 5-44. A horizontal series of temperature observed at 2 m during the night of December
31, 1992 from the R/V Wecoma moving downwind at 4 m s
-1 . Wind stress (westerly) about
0.1 N m
-2 , net surface cooling about 250 W m
-2
, the stability parameter, z s /L O = -0.1, where L O
is the Monin-Oboukhov scaling length, and average bow sensor depth z s = 2 m. (After
Wijesekera et al., 1999b.)
Figure 5-44 shows the horizontal temperature series taken during
nighttime measurements with bow sensors mounted at 2 m depth (nominal)
by Wijesekera (1999b). In order to compare this record with the data shown
in Figure 5-44 the temperature scale is reversed. The distance scale,
however, does not require reversion, because this measurement is made in
the downwind direction. The temperature series in Figure 5-44 reveals
Patterned on Figure 4 of Thorpe (1987), which shows processes of the
vertical transport in a stably stratified shear boundary layer of the upper
ocean, Figure 5-42 reconstructs water circulation in unstably stratified
conditions. As the ship moves upwind, the ramps are observed as the probe
passes from the “warm water” to the “cold water” side of the inclined sharp
interfaces (Figure 5-42). The ramps on the temperature record shown in
Figure 5-43a, b and Figure 5-44 are consistent with this sketch.
5.6.3 Skewness of temperature derivative
The presence of ramp-like structures in the temperature records leads to
asymmetry of the probability distribution function (PDF) for the temperature
derivative (Thorpe, 1985). A measure of PDF asymmetry is the skewness,
P 3 , which is defined as follows:
ramp-like structures similar to those in Figure 5-43.
359
surface cooling, which is opposite to its atmospheric counterpart where the
unstable stratification is due to warming of the underlying surface. The
reason for the reversion of the time coordinate in the oceanic data series is
that the ship was traveling into the wind; the bow sensors crossed the
structures in the ocean layer in the direction opposite to the relative direction
of the air flow during the measurements with a fixed sensor in the Antonia et
al. (1979) experiment (Figure 5-43c).
Figure 5-44. A horizontal series of temperature observed at 2 m during the night of December
31, 1992 from the R/V Wecoma moving downwind at 4 m s
-1 . Wind stress (westerly) about
0.1 N m
-2 , net surface cooling about 250 W m
-2
, the stability parameter, z s /L O = -0.1, where L O
is the Monin-Oboukhov scaling length, and average bow sensor depth z s = 2 m. (After
Wijesekera et al., 1999b.)
Figure 5-44 shows the horizontal temperature series taken during
nighttime measurements with bow sensors mounted at 2 m depth (nominal)
by Wijesekera (1999b). In order to compare this record with the data shown
in Figure 5-44 the temperature scale is reversed. The distance scale,
however, does not require reversion, because this measurement is made in
the downwind direction. The temperature series in Figure 5-44 reveals
Patterned on Figure 4 of Thorpe (1987), which shows processes of the
vertical transport in a stably stratified shear boundary layer of the upper
ocean, Figure 5-42 reconstructs water circulation in unstably stratified
conditions. As the ship moves upwind, the ramps are observed as the probe
passes from the “warm water” to the “cold water” side of the inclined sharp
interfaces (Figure 5-42). The ramps on the temperature record shown in
Figure 5-43a, b and Figure 5-44 are consistent with this sketch.
5.6.3 Skewness of temperature derivative
The presence of ramp-like structures in the temperature records leads to
asymmetry of the probability distribution function (PDF) for the temperature
derivative (Thorpe, 1985). A measure of PDF asymmetry is the skewness,
P 3 , which is defined as follows:
ramp-like structures similar to those in Figure 5-43.
359