

Chapter 5. SPATIALLY-COHERENT STRUCTURES
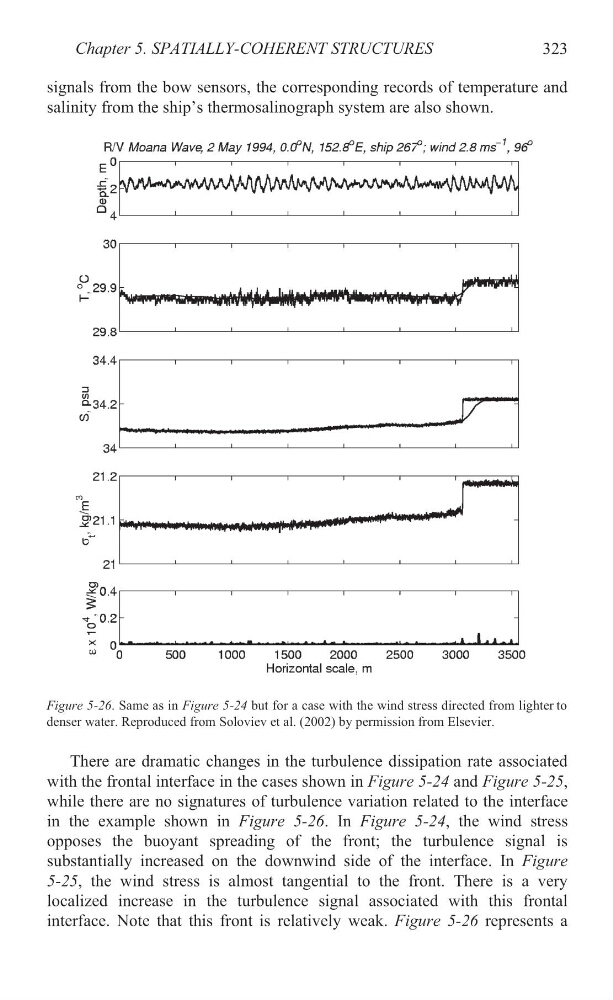
signals from the bow sensors, the corresponding records of temperature and
salinity from the ship’s thermosalinograph system are also shown.
There are dramatic changes in the turbulence dissipation rate associated
with the frontal interface in the cases shown in Figure 5-24 and Figure 5-25,
while there are no signatures of turbulence variation related to the interface
in the example shown in Figure 5-26. In Figure 5-24, the wind stress
opposes the buoyant spreading of the front; the turbulence signal is
substantially increased on the downwind side of the interface. In Figure
5-25, the wind stress is almost tangential to the front. There is a very
localized increase in the turbulence signal associated with this frontal
interface. Note that this front is relatively weak. Figure 5-26 represents a
323
Figure 5-26. Same as in Figure 5-24 but for a case with the wind stress directed from lighter to
denser water. Reproduced from Soloviev et al. (2002) by permission from Elsevier.
signals from the bow sensors, the corresponding records of temperature and
salinity from the ship’s thermosalinograph system are also shown.
There are dramatic changes in the turbulence dissipation rate associated
with the frontal interface in the cases shown in Figure 5-24 and Figure 5-25,
while there are no signatures of turbulence variation related to the interface
in the example shown in Figure 5-26. In Figure 5-24, the wind stress
opposes the buoyant spreading of the front; the turbulence signal is
substantially increased on the downwind side of the interface. In Figure
5-25, the wind stress is almost tangential to the front. There is a very
localized increase in the turbulence signal associated with this frontal
interface. Note that this front is relatively weak. Figure 5-26 represents a
323
Figure 5-26. Same as in Figure 5-24 but for a case with the wind stress directed from lighter to
denser water. Reproduced from Soloviev et al. (2002) by permission from Elsevier.