

THE NEAR-SURFACE LAYER OF THE OCEAN
It is intriguing that the frontal interfaces often appear in groups. Figure
5-23 shows an example of such variation. The temperature, salinity, and
density series reveal a quasi-periodic structure of about 10-60 km
wavelength observed on the background of the mean horizontal density
gradient of about 0.001 kg m
-3 km
-1 . A feature of this structure is its strong
asymmetry. A gradual rise of density is followed by its abrupt reduction.
Frontal interfaces can presumably interact with the wind drift current
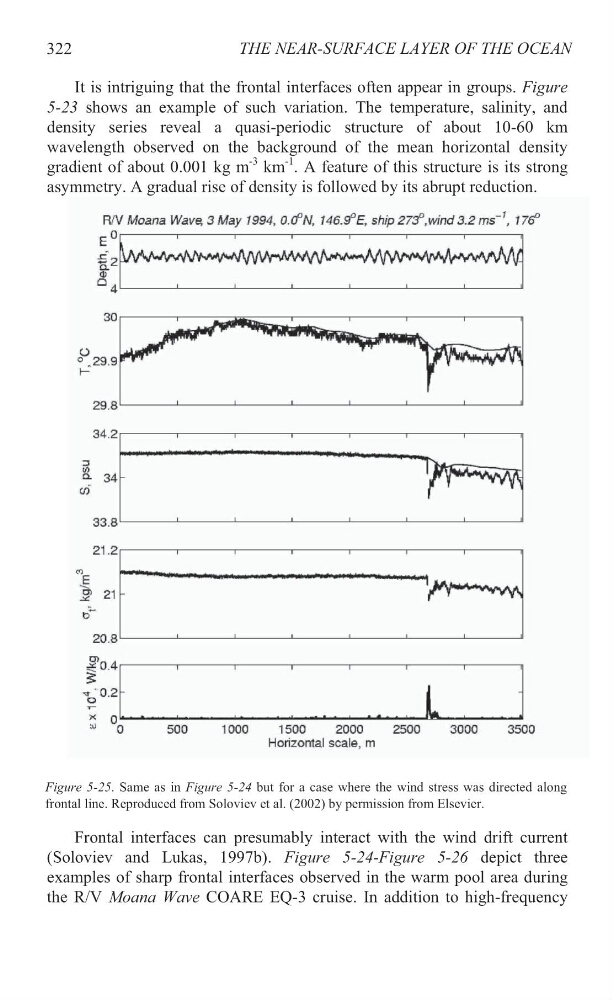
(Soloviev and Lukas, 1997b). Figure 5-24-Figure 5-26 depict three
examples of sharp frontal interfaces observed in the warm pool area during
the R/V Moana Wave COARE EQ-3 cruise. In addition to high-frequency
322
Figure 5-25. Same as in Figure 5-24 but for a case where the wind stress was directed along
frontal line. Reproduced from Soloviev et al. (2002) by permission from Elsevier.
It is intriguing that the frontal interfaces often appear in groups. Figure
5-23 shows an example of such variation. The temperature, salinity, and
density series reveal a quasi-periodic structure of about 10-60 km
wavelength observed on the background of the mean horizontal density
gradient of about 0.001 kg m
-3 km
-1 . A feature of this structure is its strong
asymmetry. A gradual rise of density is followed by its abrupt reduction.
Frontal interfaces can presumably interact with the wind drift current
(Soloviev and Lukas, 1997b). Figure 5-24-Figure 5-26 depict three
examples of sharp frontal interfaces observed in the warm pool area during
the R/V Moana Wave COARE EQ-3 cruise. In addition to high-frequency
322
Figure 5-25. Same as in Figure 5-24 but for a case where the wind stress was directed along
frontal line. Reproduced from Soloviev et al. (2002) by permission from Elsevier.