

Chapter 4: FINE STRUCTURE AND MICROSTRUCTURE
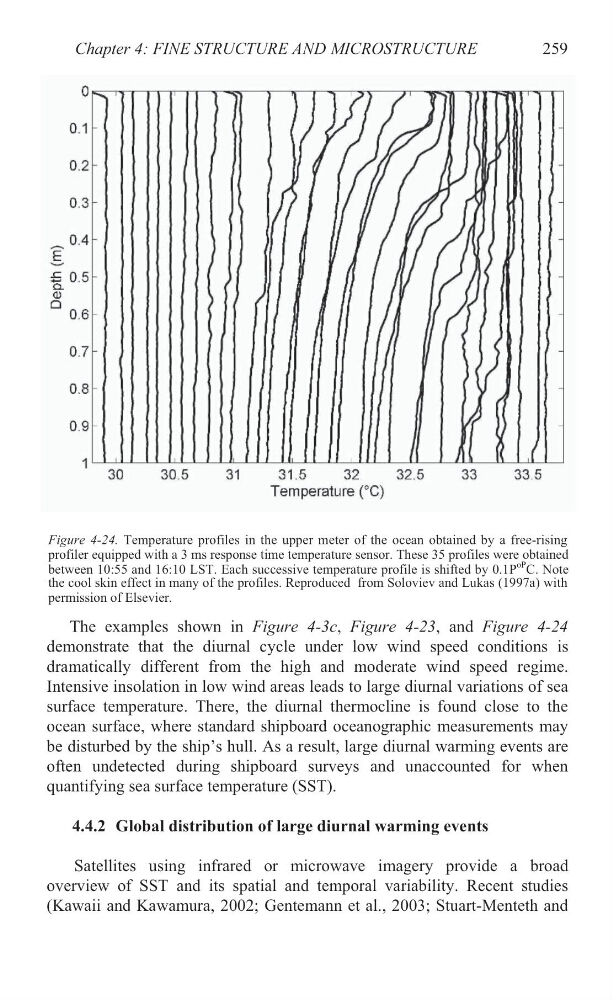
The examples shown in X Figure 4-3c, X Figure 4-23, and X Figure 4-24
demonstrate that the diurnal cycle under low wind speed conditions is
dramatically different from the high and moderate wind speed regime.
Intensive insolation in low wind areas leads to large diurnal variations of sea
surface temperature. There, the diurnal thermocline is found close to the
ocean surface, where standard shipboard oceanographic measurements may
be disturbed by the ship’s hull. As a result, large diurnal warming events are
often undetected during shipboard surveys and unaccounted for when
quantifying sea surface temperature (SST).
4.4.2 Global distribution of large diurnal warming events
Satellites using infrared or microwave imagery provide a broad
overview of SST and its spatial and temporal variability. Recent studies
(Kawaii and Kawamura, 2002; Gentemann et al., 2003; Stuart-Menteth and
259
profiler equipped with a 3 ms response time temperature sensor. These 35 profiles were obtained
between 10:55 and 16:10 LST. Each successive temperature profile is shifted by 0.1P
oP C. Note
the cool skin effect in many of the profiles. Reproduced from Soloviev and Lukas (1997a) with
permission of Elsevier.
Figure 4-24. Temperature profiles in the upper meter of the ocean obtained by a free-rising
The examples shown in X Figure 4-3c, X Figure 4-23, and X Figure 4-24
demonstrate that the diurnal cycle under low wind speed conditions is
dramatically different from the high and moderate wind speed regime.
Intensive insolation in low wind areas leads to large diurnal variations of sea
surface temperature. There, the diurnal thermocline is found close to the
ocean surface, where standard shipboard oceanographic measurements may
be disturbed by the ship’s hull. As a result, large diurnal warming events are
often undetected during shipboard surveys and unaccounted for when
quantifying sea surface temperature (SST).
4.4.2 Global distribution of large diurnal warming events
Satellites using infrared or microwave imagery provide a broad
overview of SST and its spatial and temporal variability. Recent studies
(Kawaii and Kawamura, 2002; Gentemann et al., 2003; Stuart-Menteth and
259
profiler equipped with a 3 ms response time temperature sensor. These 35 profiles were obtained
between 10:55 and 16:10 LST. Each successive temperature profile is shifted by 0.1P
oP C. Note
the cool skin effect in many of the profiles. Reproduced from Soloviev and Lukas (1997a) with
permission of Elsevier.
Figure 4-24. Temperature profiles in the upper meter of the ocean obtained by a free-rising