

THE NEAR-SURFACE LAYER OF THE OCEAN
A series of individual vertical temperature profiles shown in X Figure 4-24
evidences that the depth of the diurnal mixed layer can decrease to ~10 cm
or even disappear completely for some time under weak winds and strong
insolation. The part of the vertical temperature profiles most near the surface
sometimes has a slightly unstable stratification. Negative temperature
gradients arise during daytime on account of a combination of the volume
absorption of solar radiation in the upper cm of the ocean and the surface
cooling (Kraus and Rooth, 1961; Turner, 1973; Soloviev, 1979; and Chapter
2).
258
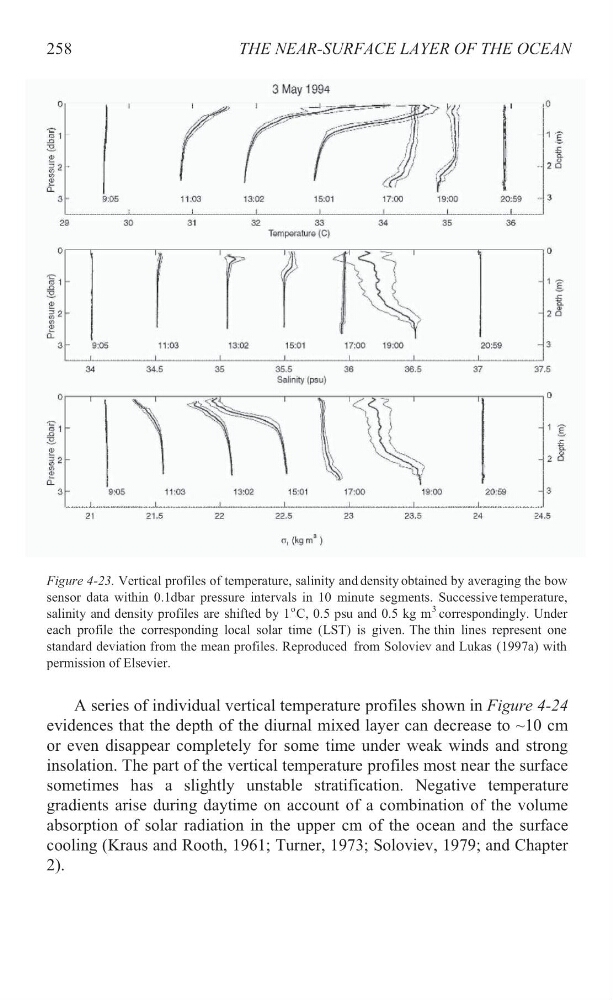
sensor data within 0.1dbar pressure intervals in 10 minute segments. Successive temperature,
salinity and density profiles are shifted by 1P
o
PC,
0.5 psu and 0.5 kg mP
3
P
correspondingly. Under
each profile the corresponding local solar time (LST) is given. The thin lines represent one
standard deviation from the mean profiles. Reproduced from Soloviev and Lukas (1997a) with
permission of Elsevier.
Figure 4-23. Vertical profiles of temperature, salinity and density obtained by averaging the bow
A series of individual vertical temperature profiles shown in X Figure 4-24
evidences that the depth of the diurnal mixed layer can decrease to ~10 cm
or even disappear completely for some time under weak winds and strong
insolation. The part of the vertical temperature profiles most near the surface
sometimes has a slightly unstable stratification. Negative temperature
gradients arise during daytime on account of a combination of the volume
absorption of solar radiation in the upper cm of the ocean and the surface
cooling (Kraus and Rooth, 1961; Turner, 1973; Soloviev, 1979; and Chapter
2).
258
sensor data within 0.1dbar pressure intervals in 10 minute segments. Successive temperature,
salinity and density profiles are shifted by 1P
o
PC,
0.5 psu and 0.5 kg mP
3
P
correspondingly. Under
each profile the corresponding local solar time (LST) is given. The thin lines represent one
standard deviation from the mean profiles. Reproduced from Soloviev and Lukas (1997a) with
permission of Elsevier.
Figure 4-23. Vertical profiles of temperature, salinity and density obtained by averaging the bow