

Chapter 4: FINE STRUCTURE AND MICROSTRUCTURE
P
Figure 4-11X shows the temperature and salinity microstructure of the
upper ocean after rainfall. These observations were made in the Inter233
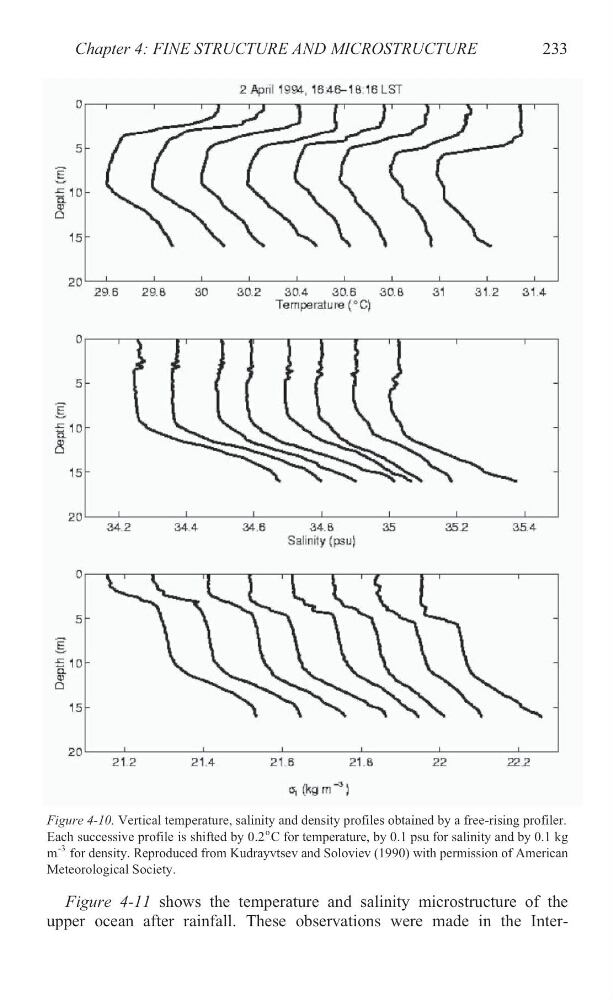
Figure 4-10. Vertical temperature, salinity and density profiles obtained by a free-rising profiler.
Each successive profile is shifted by 0.2P
o
PC
for temperature, by 0.1 psu for salinity and by 0.1 kg
mP
-3
P
Meteorological Society.
for density. Reproduced from Kudrayvtsev and Soloviev (1990) with permission of American
P
Figure 4-11X shows the temperature and salinity microstructure of the
upper ocean after rainfall. These observations were made in the Inter233
Figure 4-10. Vertical temperature, salinity and density profiles obtained by a free-rising profiler.
Each successive profile is shifted by 0.2P
o
PC
for temperature, by 0.1 psu for salinity and by 0.1 kg
mP
-3
P
Meteorological Society.
for density. Reproduced from Kudrayvtsev and Soloviev (1990) with permission of American