

Chapter 4: FINE STRUCTURE AND MICROSTRUCTURE
229
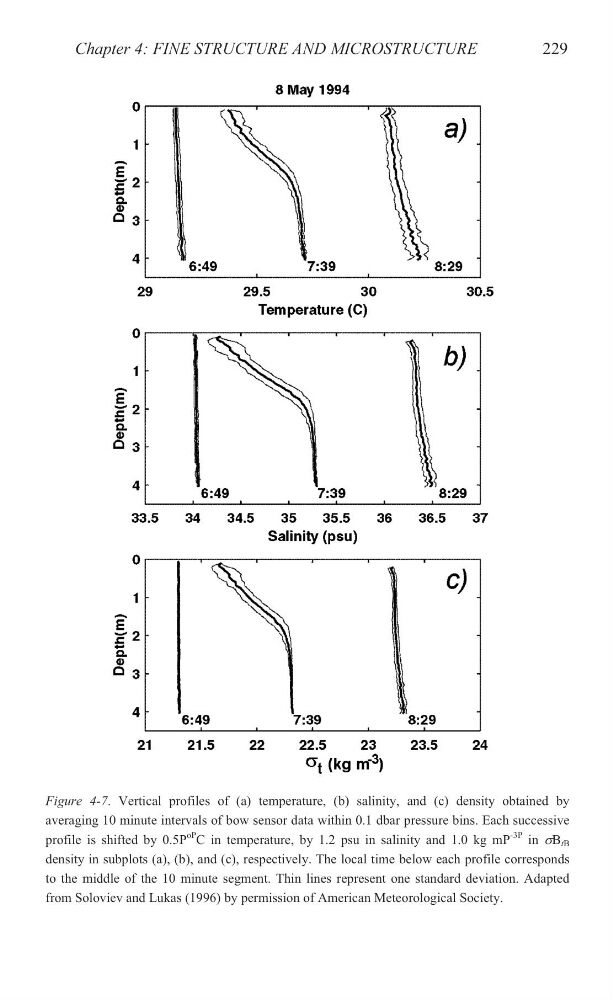
Figure 4-7. Vertical profiles of (a) temperature, (b) salinity, and (c) density obtained by
averaging 10 minute intervals of bow sensor data within 0.1 dbar pressure bins. Each successive
profile is shifted by 0.5P
oP
C in temperature, by 1.2 psu in salinity and 1.0 kg mP
-3P in VB tB
density in subplots (a), (b), and (c), respectively. The local time below each profile corresponds
to the middle of the 10 minute segment. Thin lines represent one standard deviation. Adapted
from Soloviev and Lukas (1996) by permission of American Meteorological Society.
229
Figure 4-7. Vertical profiles of (a) temperature, (b) salinity, and (c) density obtained by
averaging 10 minute intervals of bow sensor data within 0.1 dbar pressure bins. Each successive
profile is shifted by 0.5P
oP
C in temperature, by 1.2 psu in salinity and 1.0 kg mP
-3P in VB tB
density in subplots (a), (b), and (c), respectively. The local time below each profile corresponds
to the middle of the 10 minute segment. Thin lines represent one standard deviation. Adapted
from Soloviev and Lukas (1996) by permission of American Meteorological Society.